Under the Obama Administration, the U.S. Department of Agriculture (USDA) has focused in a consistent and substantive way on investments in local and regional food systems. Its innovative online tool — appropriately named the “Know Your Farmer, Know Your Food Compass Map” — allows organizations and individuals to search an online database and map to explore how different communities around the country are using these federal programs. The map was revised and re-released just last week.
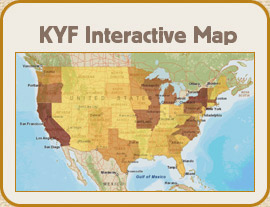
This Compass tool is a visual way to see the growing support for local and regional food system projects between 2009 and 2014. The interactive map displays data on “local food system infrastructure” including regional food hubs, wholesale markets, farmers markets, and meat processing facilities. This list is not comprehensive, but does aim to provide a wide range of data from multiple USDA agencies in a more transparent way.
NSAC has long been supportive of expansion of funding for regional and local food systems, and led advocacy efforts that resulted in the 2014 Farm Bill making the biggest-ever federal investment – to the tune of $884 million in total farm bill funding of which $501 million was new funding – to support such efforts. These programs facilitate healthy food access, help farmers add value to their products, help farmers sell directly to consumers and institutions, and build needed infrastructure like processing facilities and food hubs, enabling farmers to reach more customers.
We were excited about this revised tool and decided to take a closer look at the data that underlies the map. Here are some highlights of what we found.
Awards by Program
The top five grant programs by total number of awards between 2009 and 2014 are shown in the chart below.
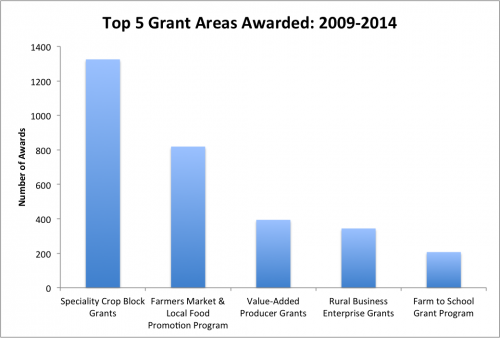
The top program in number of awards and also in funding level is the Specialty Crop Block Grant Program. The block grants to states can support a wide array of projects including but not limited to such local and regional food systems topics as value-added processing businesses, food hub development, farmer food safety training, and farm to school initiatives.
Rounding out the top five are the Farmers Market and Local Food Promotion Program, Value-Added Producer Grants, Rural Business Enterprise Grants, and Farm to School Grants.
The Sustainable Agriculture Research and Education, Community Facilities, Community Food Project Competitive Grants, Rural Cooperative Development Grants, and the Risk Management Education Partnerships Program are the next five in total number of awards between 2009 and 2014, at 159, 152, 136, 120, and 98, respectively.
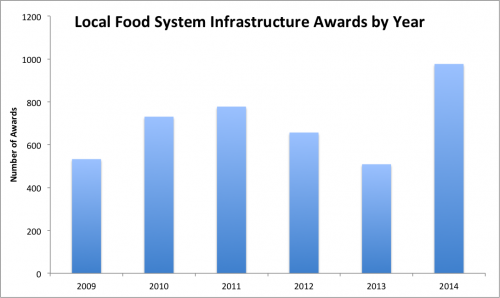
Awards by Year
The number of Know Your Farmer, Know Your Food relevant awards counting all programs reached a peak in 2014, the first year of increased 2014 Farm Bill support, with a total of 977 awards given around the United States through USDA programs. This new higher level of support should hold true for the rest of the current farm bill cycle through 2018.
Not surprisingly, 2013 marked the low point for awards, due to many of the key local and regional farm and food programs being left stranded by the disastrous sone-year farm bill extension process.
Awards by State
All 50 states participate in local food infrastructure programs. California, New York, and Missouri were the top three states receiving awards in local food system infrastructure between 2009 and 2014, at 303, 189, and 149 respectively. Rounding out the top ten are Michigan, North Carolina, Virginia, Massachusetts, Illinois, Oregon, and Wisconsin.

Awards by Blue, Red, Purple State Breakdown
In terms of a regional political breakdown, we analyzed the number of awards given in the various political divisions. We divided the 50 states into the three categories of blue, red, and purple based on their voting records in the last four presidential elections.
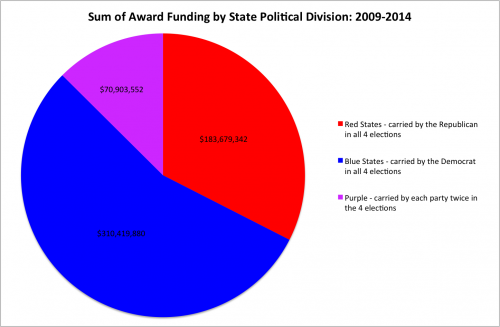
Blue states, which represent about half the US population, received about 55 percent of the total funding. Red and purple states combined, which represent the other roughly half of total US population, came in at a healthy 45 percent share of grants, demonstrating the widespread appeal of this issue and these programs.
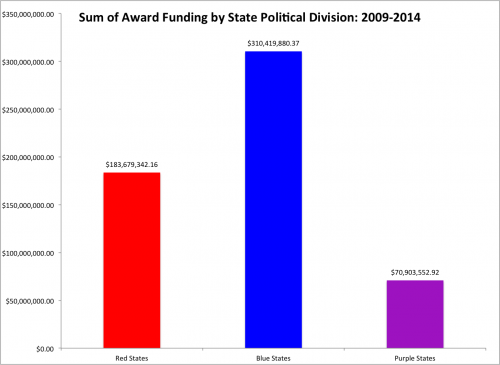
The results by political division are skewed a bit by the influence of Specialty Crop Block Grants, the largest of the programs included in the Compass. The block grants are allocated by the size of the fruit and vegetable industry in each state, and hence over 60 percent flow to blue states, most especially to California, but also to Washington, Oregon, Michigan, and New York.
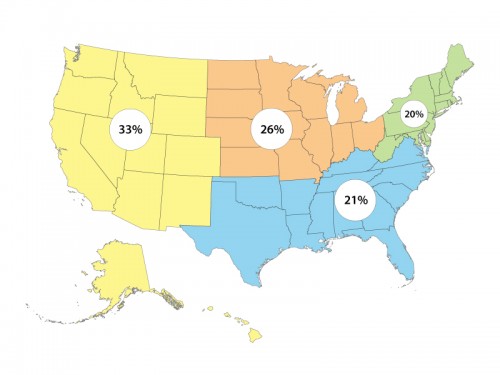
Awards by Region
One final way to look at the Compass data — the regional distribution of total funding. Here we see a fairly even distribution, with the Northeast and South receiving a fifth of the total, the North Central region roughly a quarter, and the Western region a third.
We hope this quick analysis of USDA local and regional food system investments is helpful. More importantly, we hope you will take time to explore the newly revised Compass map on the Know Your Farmer, Know Your Food website.