
Earlier this spring, the United States Department of Agriculture (USDA) released the long-awaited 2017 Census of Agriculture – a once every five years report that has been in publication since 1840. The Census of Agriculture is a critical tool for farmers, researchers, and food/farm activists because of the wealth of data it contains about everything from farmer demographics to cover crop acreage.
Because farmers and ranchers work so intimately with the land and our shared natural resources, understanding the prevalence and impact of conservation activities is a critical part of understanding agriculture and strengthening our food and farm economy. In this post, the first in a series of Census deep dives, the National Sustainable Agriculture Coalition (NSAC) examines what the Census has to say about conservation and energy and highlights themes and key takeaways for sustainable agriculture advocates.
- Grass vs. Cropland
- Easements
- Rotational Grazing
- Cover Crops
- Tillage
- Fertilizers and Chemicals
- Renewable Energy
Grass vs. Cropland
The Census reports on the extent of pasture and grazing land through two categories:
- Pasture and grazing land that could have been used for crops without additional improvement.
- Permanent pasture and rangeland, other than cropland and woodland pastured.
Category one is for cropland used for pasture. It includes high quality land that could easily be used for crop production, but is instead used as pasture. This category also includes crops grazed by livestock, but not harvested prior to grazing. It does not include crop residue left in the field after the 2017 harvest and later grazed by livestock. Category two is for pastureland unfit (without additional improvements) for crop production, and includes both high and low quality pasture.
As illustrated in the chart below, the 2017 Census reports 13.8 million acres devoted to pasture and grazing land that could have been used for crop production. This is an eight percent increase from the 2012 Census, which reported 12.8 million acres.
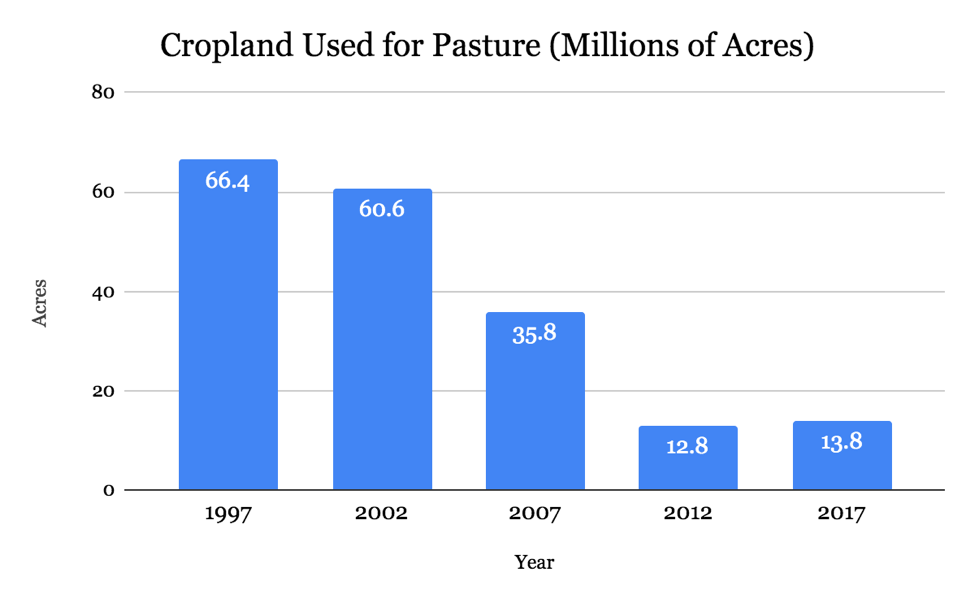
Despite this increase, the first time in 20 years that the number has increased, it is still well below historic levels. Since the 1997 high of 66.4 million acres, the amount of cropland used for pasture has steadily declined. In contrast, “permanent” grassland decreased between from 2012 and 2017 by 3.5 percent, from 415.3 million to 400.7 million acres. For the past 20 years this number has hovered at around 400 million.
While the slight increase in cropland used for pasture between the 2012 and 2017 censuses may be an anomaly, the general decrease of pastureland over time speaks to larger land utilization trends in the United States. Farmers and landowners increasingly face many pressures to convert wetlands and grasslands into croplands; particularly worrisome of late given the slumping farm economy, has been the mounting pressure on producers and landowners to sell farmland to developers for housing and commercial development.
NSAC is cautiously optimistic at the uptick in cropland being used for pasture, as grasslands are highly productive ecosystems that support an abundance of plants and animals and provide a wide range of ecological benefits (e.g., water filtration, flood mitigation, erosion control, wildlife habitat, and carbon sequestration). Moreover, healthy grasslands are a critical component of America’s ranching and hunting economies. Farmers and ranchers who engage in federal conservation programs like the Conservation Reserve Program (CRP) can reap economic benefits while also helping to restore and protect ecologically sensitive lands (including grasslands). Applications are now being accepted for 2019 Continuous CRP enrollment, more information from the Farm Service Agency on the signup period and how to apply is available here.
Easements
Conservation easements are critical for the preservation of ecologically sensitive lands. The Agricultural Conservation Easement Program (ACEP) is the primary federal program through which easement are voluntarily entered by a property owner and a qualified conservation entity, such as a governmental agency or land trust. Established by the 2014 Farm Bill, ACEP includes both wetland and agriculture land easement components. The 2018 Farm Bill increased annual funding available through ACEP, which we expect will increase the availability of conservation easements moving forward.
At the recording of the Census, 53,920 farms were operating under a conservation easement; including federal and non-federal easements. This was a 29 percent decrease from 2012 Census levels, which recorded 76,441 farms under conservation easements.
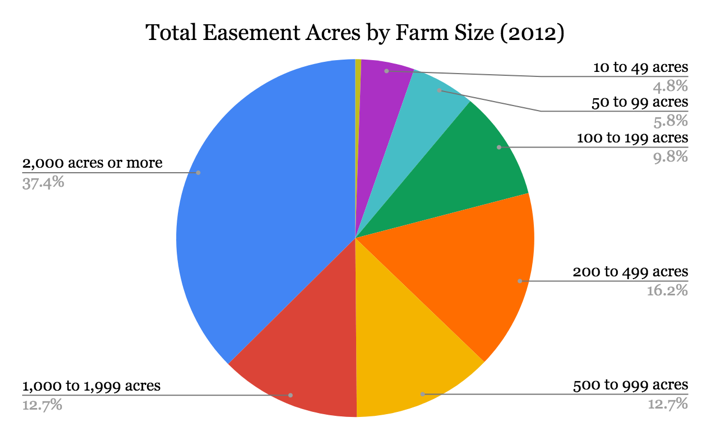
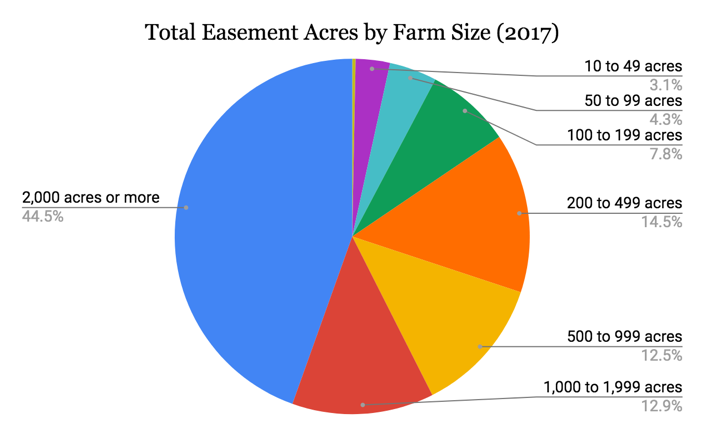
The most recent data show that the average easement size at 243 acres – a 40 percent increase from the last census – and that the majority of easements ranged from 1 to 50 acres. It is also notable that the number of 2,000+ acres farms under easements grew by 78.6 percent since the last census, up to a total of 1,607. The increase in large acreage easements could, in part, explain why the total number of acres stayed at around 13,000 between 2012 and 2017 even though the number of farms under easements decreased dramatically.
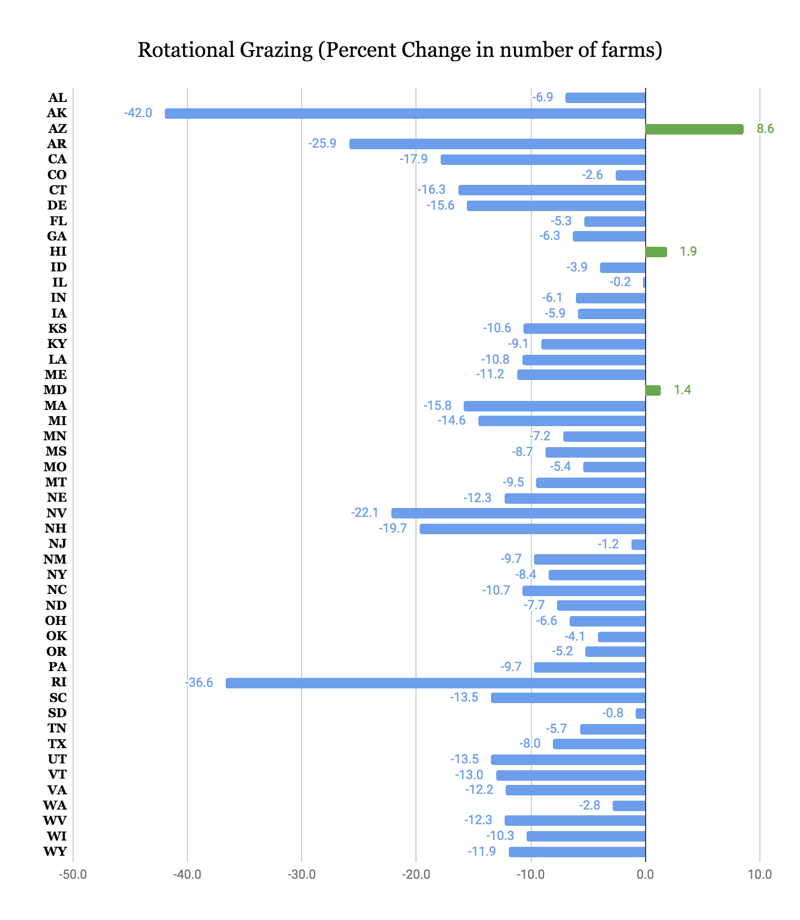
Rotational Grazing
Between the 2012 and 2017 censuses, the number of farm operations practicing rotational or management-intensive grazing decreased by 8 percent; from nearly 289,000 to about 265,000. As shown in the chart below, only three states saw an increase over this period: Arizona, Hawaii, and Maryland.
NSAC has long been a champion of rotational and management-intensive grazing, and has successfully increased support for these activities through our advocacy on farm bill conservation programs. We are pleased that the 2018 Farm Bill included critical reforms to increase support for advanced grazing management systems, including the increase of payment rates within the Conservation Stewardship Program (CSP) to 150% for advanced grazing management practices. Additionally, the farm bill specifies that the livestock set-aside within the Environmental Quality Incentives Program (EQIP) includes grazing management practices. The acreage target for the CRP Grassland Initiative was also increased in the 2018 Farm Bill, providing further opportunity for grazing management on acres kept in conservation cover.
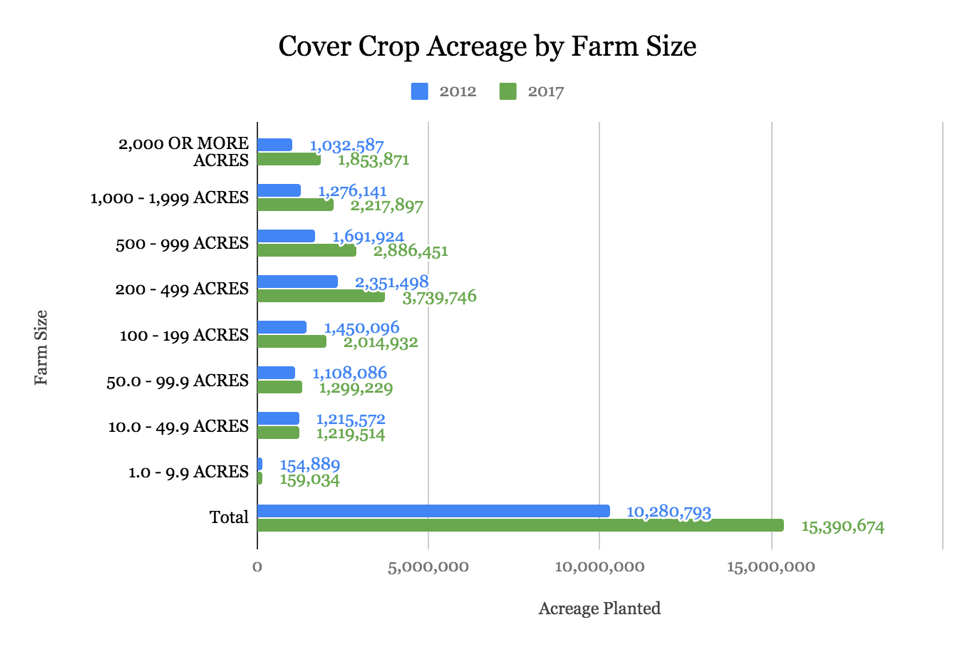
Cover Crops
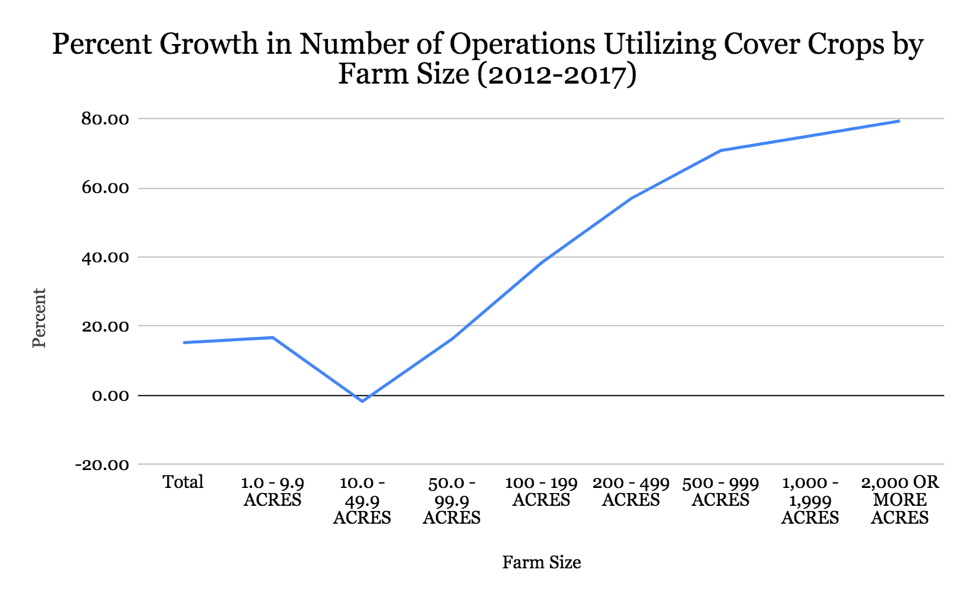
At the recording of the 2017 Census, farmers had planted cover crops on about 15.4 million acres; not including land enrolled in CRP. This is a 50 percent increase in acres above 2012 Census levels, and a 15 percent increase (to a total of 153,403) in the number of farms nationwide using cover crops. The chart below illustrates the change in cover crop utilization by farm size.
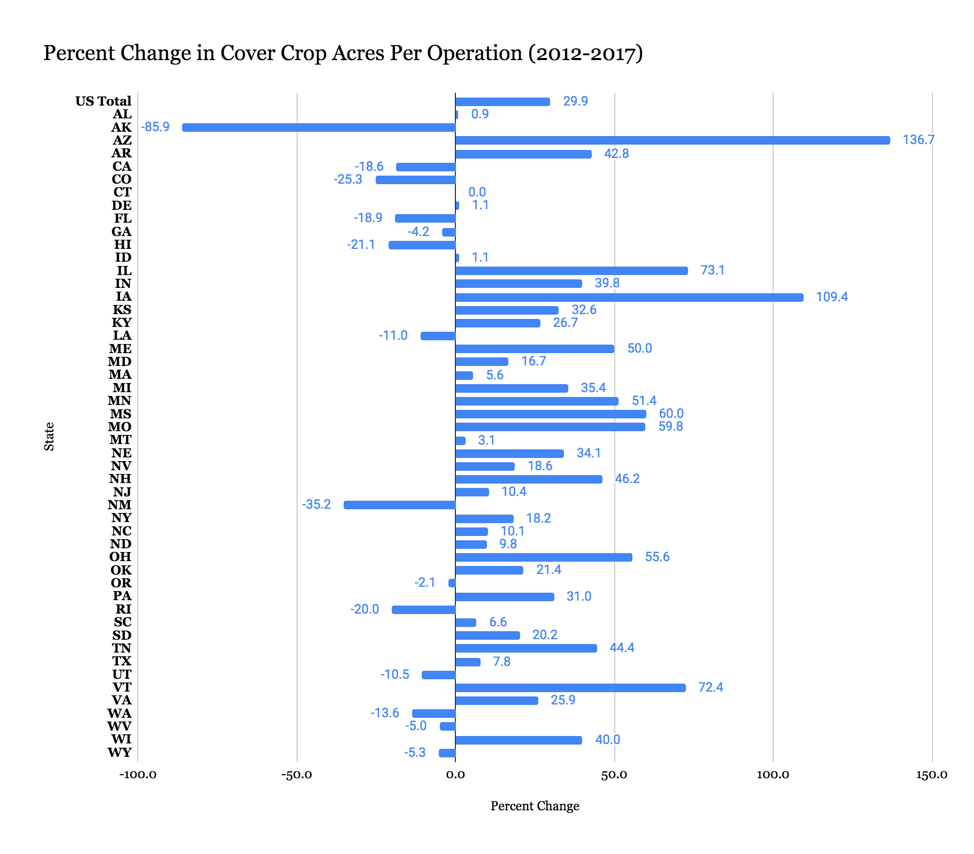
The average number of acres of cover crops per farm increased by 30 percent, from 77 to 100 acres, between the 2012 and 2017 censuses. As illustrated in the chart below, although the average number of cover crop acres per operation increased overall, growth was not even across the country. Arizona and Iowa skewed the average dramatically, experiencing 136 percent and 109 percent growth respectively. Several states, including California, Colorado, Florida, and New Mexico, saw a downward trend in cover crop acres per operation.
The 2018 Farm Bill included several provisions aimed at increasing cover crop adoption in support of improved soil health and water quality, and soil erosion mitigation. For example, the farm bill increased the payment rate for cover crops within CSP to 125 percent of the otherwise determined payment rate as an incentive to adopt cover crops. Additionally, the farm bill eliminated barriers to cover crop adoption within the federal crop insurance program.
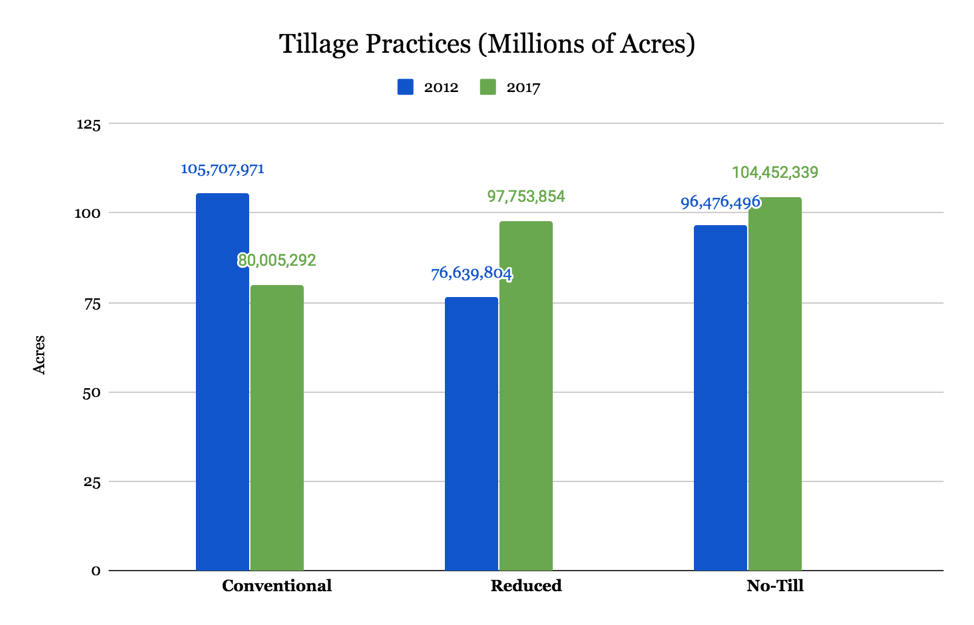
Tillage
Almost 280,000 farms reported using no-till practices on approximately 104.5 million acres in the 2017 Census of Agriculture. Compared to 2012 figures, we see an eight percent increase in the number of acres in no-till, up from 96.5 million. As of 2017, the average number of no-till acres per farm was 374 acres.
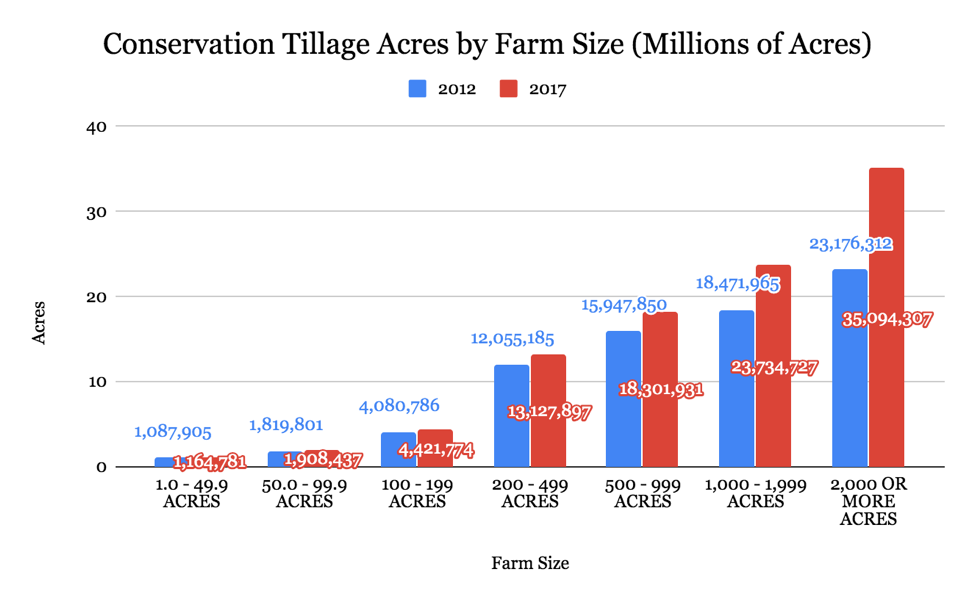
Additionally, more than 217,000 farms used reduced tillage methods, such as mulch till and ridge till, on over 97.7 million acres – an increase of 28 percent since the 2012 Census. The average number of acres per farm using reduced tillage methods also increased, from 392 to 450. At the same time, intensive/conventional tillage decreased both in the number of acres and in the total number of farms. The number of farms that used conventional tillage decreased by 35 percent for a total of 264,893 farms. The number of acres that used conventional tillage also decreased by 24 percent for a total of 80 million acres. As illustrated in the chart below, in total, conservation tillage, including no-till, represented a greater and growing portion of the soil management practices.
Fertilizers and Chemicals
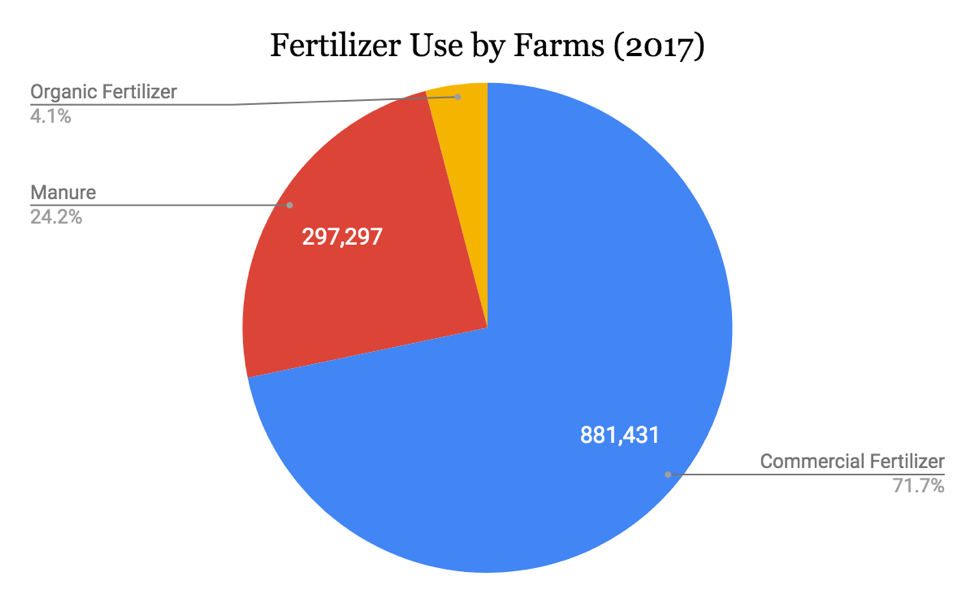
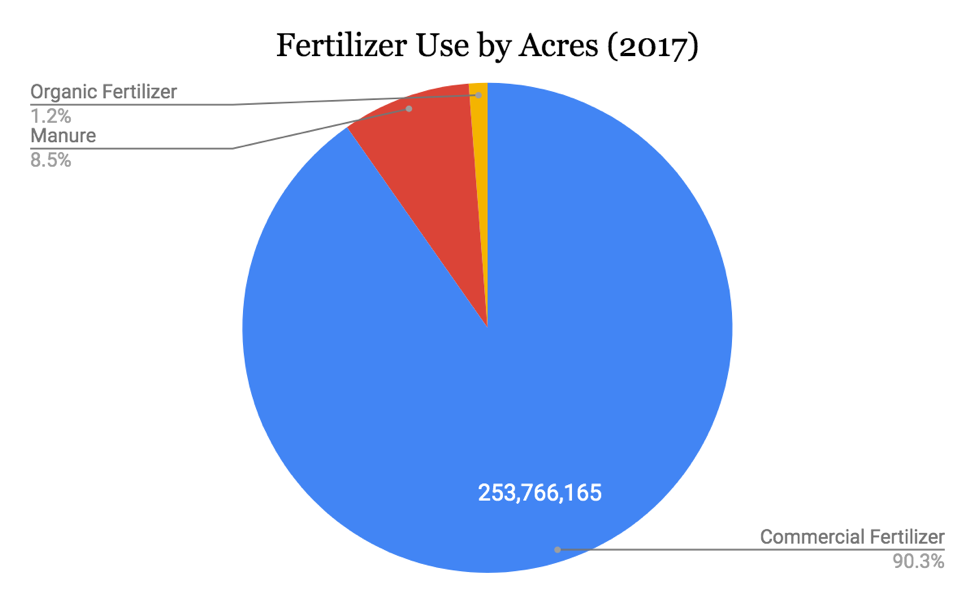
The use of commercial fertilizer, lime, and soil conditioners has remained steady, while manure application has increased since the last census. Between 2012 and 2017, the number of farms that used commercial fertilizer stayed about the same at around 880,000. The number of farms that used manure, however, increased eight percent (from 275,420 to 297,297). For the first time, the Census also included data on the number of farms that use organic fertilizer. Over 50,000 farms reported using organic fertilizers on nearly 3.5 million acres. However, it should be noted that conventional organic manure may be applied to organic production acres.
The Census also provides data on the use of chemicals such as pesticides, herbicides, and defoliants. While the number of farms that apply these chemicals decreased by 13 percent for a total of 1.2 million farms, the number of acres sprayed with these chemicals has increased by seven percent for a total of 479,152,140 acres. This information suggests that while individual farms may opting out of the use of these chemicals, larger farms may have increased their application.
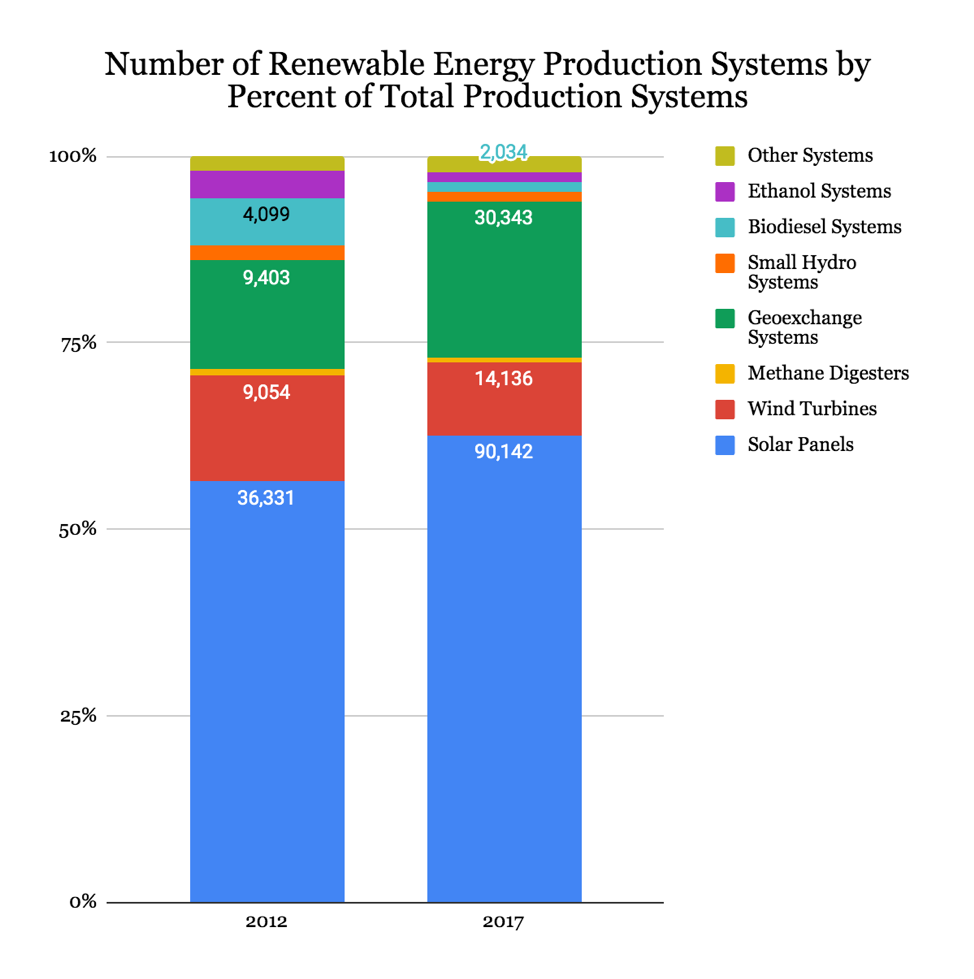
Renewable Energy
According to the 2017 Census, the number of farms that included renewable energy production systems increased by 132 percent (from 57,299 to 133,176). The number of operations with solar panels increased by 148 percent, wind turbines increased by 56 percent, methane digesters increased by 28 percent, geothermal/geoexchange systems increased by 223 percent, and small hydro systems increased by 29 percent. The number of operations that leased their wind rights to others also increased by 97 percent.
In contrast, biodiesel systems decreased by 50 percent, and ethanol systems decreased by 26 percent. The increasing affordability of photovoltaic and wind systems could explain the decrease in the number of biodiesel and ethanol systems.
In the face of rising pressures from extreme weather events and a worsening climate crisis, it is critical that farmers and ranchers are part of mitigation and adaptation conversations. American producers have a key role to play in developing climate crisis solutions that recognize both agriculture’s contribution to and potential to mitigate the problem. The trends illustrated by the 2017 Census reflect increased adoption of important conservation practices that sequester and store carbon, as well as on-farm renewable energy efforts. NSAC will continue to work to ensure farmers and ranchers have the tools they need to innovate and increase adoption of conservation practices and systems that provide climate change mitigation and adaptation benefits.