USDA’s Economic Research Service (ERS) recently released the Atlas of Rural and Small-Town America data set. The tool, an interactive mapping application, provides spatial information (national to county-level) of socioeconomic factors on four broad categories of :
- People— county demographic profiles including age, race/ethnicity, education, migration and immigration, household size and family composition (from the from the American Community Survey)
- Jobs—conditions and trends affecting the labor force, such as employment change, unemployment, industry, and occupational structure (from the Economic data from the Bureau of Labor Statistics and other sources)
- Agriculture—indicators of farm structure and the well-being of farm households, including farm size, income, sales, and tenure (from the latest Census of Agriculture)
- County classifications—ERS county classifications based on the rural-urban continuum, economic structure, and other key locational features, such as landscape amenities, creative class occupations, persistent poverty, or population loss status.
The Atlas contains the latest county-level statistics from the U.S. Census Bureau, the Bureau of Labor Statistics (BLS), the Bureau of Economic Analysis, USDA, and other Federal sources; while these combination of data provides a comprehensive data set, it is also the reason for the variations on time periods in the data.
What can users do with the Atlas?
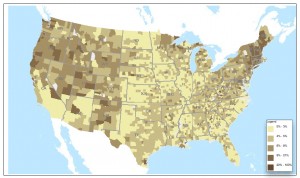
The Atlas allows users to create national to county-level maps showing the variation in the four predetermined socioeconomic factors. Following is an example of a map displaying the percent of farms with value added commodities on 2007.
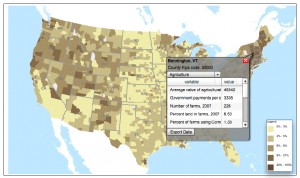
Clicking on any county produces a pop-up box containing statistics for all indicators in the relevant category, and has the option to browse data in other categories. Users can download the data by clicking on Export Data.
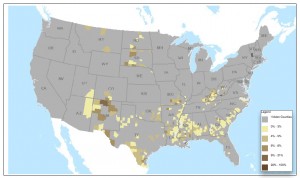
The Optional Filter alternative enables users to highlight groups of counties based on county typologies, producing a map displaying combined data sets. The following map displays the percent of farms with value added commodities on 2007, filtered by counties with persistent poverty between 1970-2000.
Once a user has configured a map to his or her satisfaction, the image may be printed or saved to a PDF- or JPG-formatted file. An appropriate legend is generated automatically. Users are able to download the data on Excel files too.
This easy-to-use tool provides up-to date information useful to better understand changing trends affecting rural America and to identify priority areas for intervention.


