

USDA Secretary Tom Vilsack in Marshalltown, IA; one of the 10 demonstration sites for the launch of the White House Rural Council’s Rural Impact Initiative. Photo credit: USDA, Darin Leach.
Nearly a decade after the 2007 recession, the U.S. economy continues to move steadily toward recovery; unemployment has been cut in half (down to 5 percent), and average family incomes have increased 6 percent in just the last two years. By now the slow but rising tide of economic improvement has touched most corners of the country, yet millions of rural children are still living in poverty. In fact, 85 percent of the country’s persistent poverty counties are in rural America.
A new analysis released this month by the U.S. Department of Agriculture’s (USDA) Economic Research Service (ERS) found that the number of rural children living in poverty is rising, despite a U.S. economy that has seen rising income and employment levels for other segments of the population. So why the increase? ERS economist Thomas Hertz and ERS geographer Tracey Farrigan co-authored the report, Understanding the Rise in Rural Child Poverty, 2003-2014, which seeks to analyze and explain changes in average rural incomes, rural demographics, and income inequality over the last decade.
While it has long been true that rural America has had higher levels of unemployment and poverty (including child poverty and deep poverty) than the rest of the country, this new report brings important new insights to bear with respect to the pervasiveness of income inequality levels in our country, making it well worth a careful read.
Summary of Findings
The report found that rural child poverty declined during the 1990s, but trended upward from 2003 to 2012. This shows the persistent nature of rural child poverty, as rates increased throughout the national economic expansion, recession, and in the initial years of economic recovery. During this period rural child poverty increased by 6.6 percentage points, peaking at 26.7 percent in 2012 – the highest it’s been since 1968.
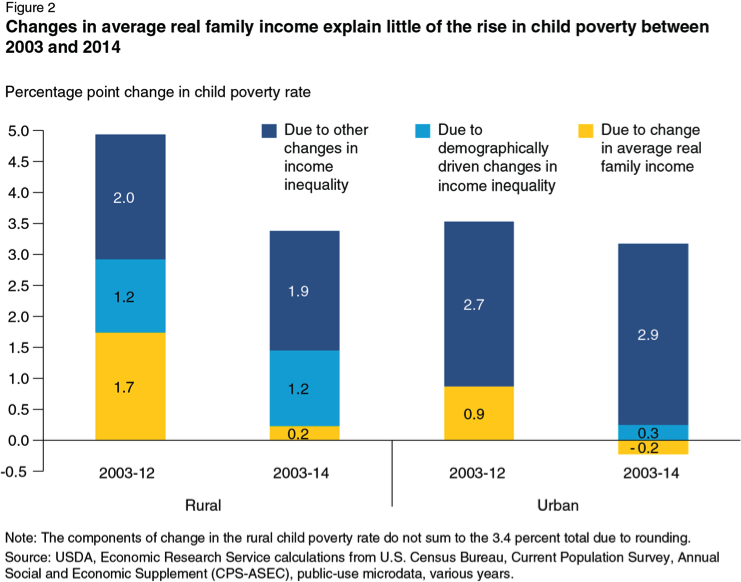
In order to explain this decade-long net increase the study examined the causes of child poverty from 2003 to 2012 and 2003 to 2014, comparing rural child poverty rates with those of urban children. Below are the results broken down by each time period.
2003 to 2007: Period of National Economic Expansion
There was a 1.4 percentage point increase in rural child poverty between 2003 and 2007. A small share, about 3 percent, of that increase can be explained by a decline in average rural incomes. The remaining 97 percent can be attributed to a worsening of rural income distribution among families with children. Within the inequality-driven increase, only 5 percent can be explained by demographic changes. In essence, 1.3 of the 1.4 percentage points were not due to declines in average incomes, but rather to rapid income declines experienced by families near the poverty line.
2007 to 2010: The Recession
During the recession, declines in average income increased rural child poverty by 0.8 percentage points, which is nearly 53 percent of the observed total change of 1.5 percentage points. Even in this case, income inequality still drove about half of the rise.
2010 to 2012: Period of National Economic Recovery
Average rural family incomes continued to decline during the initial period of economic recovery, whereas urban families saw increasing incomes and more widespread income distribution. The change in rural child poverty during this period breaks down such that 38 percent can be attributed to declining average incomes and 62 percent can be attributed to rising income inequality. Within the change driven by income inequality, demographic changes contributed to 27 percent of the increase.
2012 to 2014: Rural Child Poverty Rates Decline
Rural child poverty declined by 3 percentage points during this period. Further analysis indicates that the decline is driven almost entirely by increases in average rural income, with no change to the distribution of incomes around the average. Despite this decline, the 2003 to 2014 period shows a net increase in rural child poverty.
Policy Implications
The ERS findings makes clear that fighting income inequality is paramount to reducing rural child poverty. This study shows that income inequality is not just the result of higher incomes among the top 1 percent, it also stems from declining incomes among the poorest households. One immediate way to combat this inequity would be enhanced investments in programs that effectively lift families out of poverty, like the Supplemental Nutrition Assistance Program (SNAP) and the Earned Income Tax Credit (EITC).
USDA Secretary Vilsack, in a recent blog post addressing the report, lists two specific initiatives being taken by the administration to alleviate rural poverty: the Strikeforce Initiative for Rural Growth and Opportunity and Rural Impact.
The Strikeforce Initiative for Rural Growth and Opportunity sends teams from the various mission areas of USDA (like the Farm Service Agency and the Food and Nutrition Service) to work with community development organizations in counties with persistent poverty. The goal of Strikeforce is to create economic opportunity in some of the country’s most impoverished regions. The initiative was launched six years ago and has since taken existing USDA programs and increased the probability that funds would flow to persistent poverty areas, resulting in a total investment of $23.5 billion in over 190,000 projects from 2010-2015. Earlier this year, Secretary Vilsack announced the expansion of StrikeForce into high-poverty counties in Florida, Missouri, Montana, and Ohio.
Rural Impact, an initiative launched by the White House Rural Council in 2015, focuses on a multi-generational approach to alleviate rural poverty using public and private resources. It focuses on three areas for economic development: innovation, awareness, and investment. A more in depth look into their policy plans can be found here.
Click here to download a copy of the full ERS Report, Understanding the Rise in Rural Child Poverty, 2003-2014.