Finding a way to finance a new farming operation before money starts coming in at the end of the growing season is a challenge that all new farmers face. And while some farmers are able to save enough before they start farming, there are always inevitable start-up and annual operating expenses – like buying seeds, inputs, tractor for sale, hoop houses, fencing, and livestock – that require up-front financing.
USDA’s Farm Service Agency (FSA) has been a long-standing resource to new farmers and prides themselves on being the “lender of first opportunity” for those farmers who struggle to obtain financing from a commercial bank or other private lender.
Last year, FSA launched a new streamlined farm loan program to specifically target the credit needs of smaller farms – including those just starting out and those selling to local and regional markets. This microloan program officially launched in January of 2013, and has made over 8,400 loans in every state throughout the country, freeing up approximately $161 million in financing to new, minority, and small farmers. Check out our Grassroots Guide to learn more about how this program works.
Last fall, NSAC did an analysis of this new loan program to see how well these new loans were working in various regions across the U.S. With the close of Fiscal Year 2014, we have once again taken a closer look at where microloans are being used the most and how well they are reaching beginning farmers as well as farmers of color, veterans and female operators.
Microloan Overview
In total, nearly 5,000 microloans were made in Fiscal Year 2014 (running from September of 2013 to September 2014) in every state across the U.S. This is 1,562 more loans and 45 percent higher than the total number of microloans made in 2013. Part of the reason for this increase is the longer period for which loans were offered in 2014, since the microloan program wasn’t up and running until January of 2013, and thus last year’s loan totals only account for 9 rather than 12 months of loan-making activities.
But still, the 2014 data averages to about 416 loans per month (though it can be assumed that the majority of these loans were made earlier in the year at the start of the growing season), whereas 2013 data shows a monthly average of 381. Additionally, the total amount of microloans made in 2014 was 55 percent higher than the value of loans made the year prior. This indicates that FSA made larger microloans than in 2013. In 2014, the average size micro loan was $19,732 compared to $18,381 in 2013. The maximum loan amount for micro loans was $35,000 in 2014, but the 2014 Farm Bill increases this amount to $50,000.
From this data, it is clear that more and more farmers are finding out about this new loan program and finding that it meets their farming needs. Although, there are some interesting regional trends that show which parts of the country are finding this loan program more useful than others. Some of the key findings from the 2014 microloan data include:
- Two regions — Appalachia and the Delta — continue to dominate in making both the most number and highest percentages of microloans.
- Across the country, states are making on average slightly more microloans in 2014 than in 2013, though there are several outliers that actually made fewer loans this year.
- There continue to be states that have surprisingly low microloan usage compared to the number of small farms in that state.
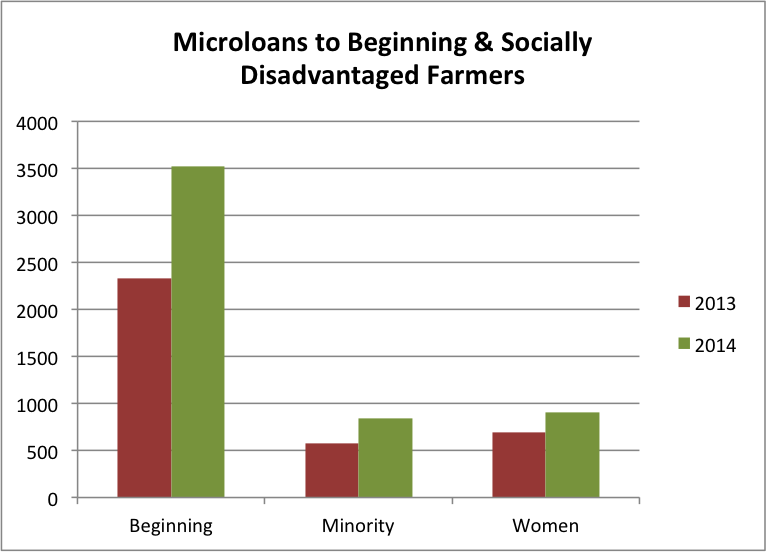
- The vast majority of microloans target beginning farmers, and a higher percentage of microloans are used by minority and women farmers than other FSA loan programs.
States Making Highest Number of Microloans
Like last year, the vast majority of states made fewer than 100 microloans in 2014, with the state average being 75. However, 32 percent of states exceeded this threshold and some made nearly 400 microloans!
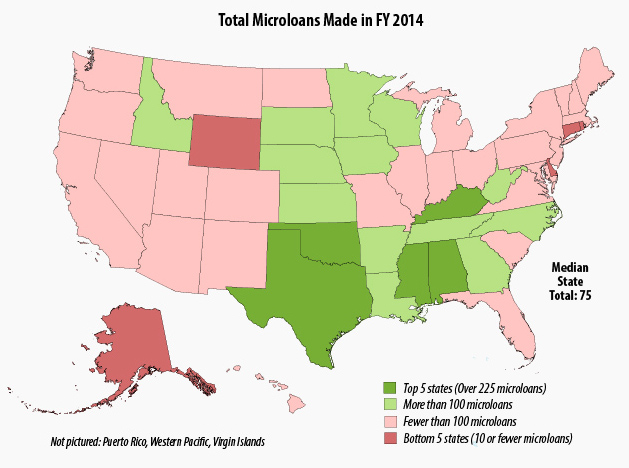
Like last year, the regions that have found microloans to be best suited to their farmers include Appalachia and the Delta region, the Southern Plains (including Texas which has the most number of farmers than any other state in the country), and the Upper Midwest.
Kentucky bumped Mississippi out of the number one state making the most number of microloans in 2014, and Texas remains a close second. Oklahoma saw a significant 95 percent increase in microloan-making activities, and is now included in the top five states. And although Wisconsin continues to make a large number of loans, the state only increased microloans made in 2014 by four percent compared to the year before.
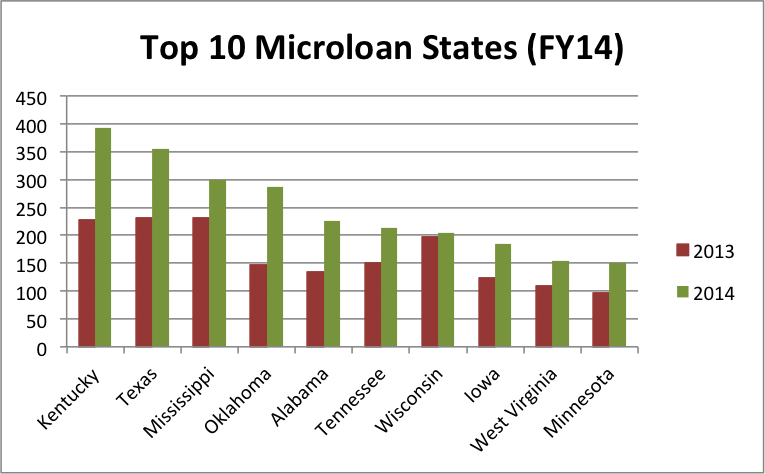
Several other states saw significant increases in the number of microloans made this past year, including Kansas which had a near four-fold increase, Idaho which doubled microloans made, and Kentucky, Arkansas and Louisiana which all saw increases of 70 percent.
Surprisingly, there were states that actually made fewer loans in 2014 and 2013, including Massachusetts (45 percent fewer microloans), New Jersey (42 percent fewer), and California (20 percent fewer). Additionally, Delaware, Rhode Island, Connecticut, and the Virgin Islands also made fewer loans in 2014 compared with 2013. It’s uncertain why these particular states saw a drop in the number of microloans, and more follow up will be needed to better understand these concerning trends.
States Making Highest Percentage of Microloans
Although the number of microloans made is a good indicator of the relative success of the program in a given state, it does not accurately reflect how popular microloans are in farmers in their state compared to other farm loan programs. It would therefore make sense that states that have large farming populations (like Texas, Kentucky, and Oklahoma) would also make the greatest number of farm loans in general – including microloans.
However, when analyzing how many microloans were made in a given state compared to the total number of FSA direct farm loans made in that state, the data paints a much different picture.
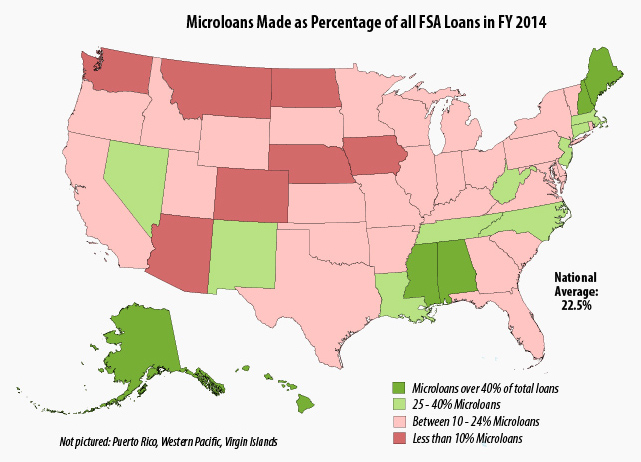
As can be seen by the map above, the states that made the highest percentage of microloans across all of their loan-making activities include states whose farms are smaller on average than some of the bigger farm states in the Plains and Midwest.
In 2014, 22.5 percent of all direct loans made by FSA were microloans, compared to 21.3 percent the year before. Although this is a modest increase, this data does show that more states are utilizing the microloan program this year.
States like Hawaii, New Hampshire, Massachusetts and much of the Northeast have high populations of small farms, and smaller farms typically have lower expenses and financing needs than larger farms, thus making the microloan program more suited to their specific farming needs.
Geographic Disparities
As can be seen by the two maps above, the states with the largest farming populations in general, as well as those states with greater numbers of small farms, continue to best utilize the new FSA microloan program in 2014.
However, there are a few states that are underperforming compared to neighboring or similar states, and more analysis is needed to better understand the reason for the surprisingly low interest in microloans across the state.
States like Arizona, California, Washington and Oregon, which all have large numbers of small farms, are making fewer microloans than would otherwise be expected.
For example, the median farm size in Arizona is just five acres, compared to neighboring New Mexico where farms are generally a bit larger (though still small nationally), with a median of 40 acres. However, over a third of the FSA loans made in New Mexico were microloans, compared to just 8 percent of loans made in Arizona. This may be due to the way in which tribal agricultural lands are counted, which may bring the median farm size down but isn’t necessarily an accurate reflection of the farm sector in that state.
Similarly, there is a higher concentration of small farms in the Pacific Northwest states of Washington and Oregon than in neighboring Idaho, however Idaho was able to carve out twice as much of their total loan portfolio to microloans than its neighboring states.
There are similar trends in New Hampshire and Vermont, which have similar size farms, although NH had a much higher percentage of microloans made in the state.
Other states that made a disproportionately low percentage of microloans compared to the numbers of small farms in the state include:
- Utah and Colorado in the West
- Indiana, Michigan, and Ohio in the Midwest
- Pennsylvania and Vermont in the Northeast
These trends could be an issue of outreach to make sure that the small farmers in these states are aware of FSA in general and the microloan program in particular. Or, if farms are on a small-enough scale, they may be able to find alternative ways to finance very small farm purchases.
Conversely, Mississippi, which has a large number of larger farms, has made an impressively high number of microloans. It would be interesting to better understand the reasoning for the high usage in this state in particular, and what kinds of farmers are being served by the new microloan program.
Beginning Farmers
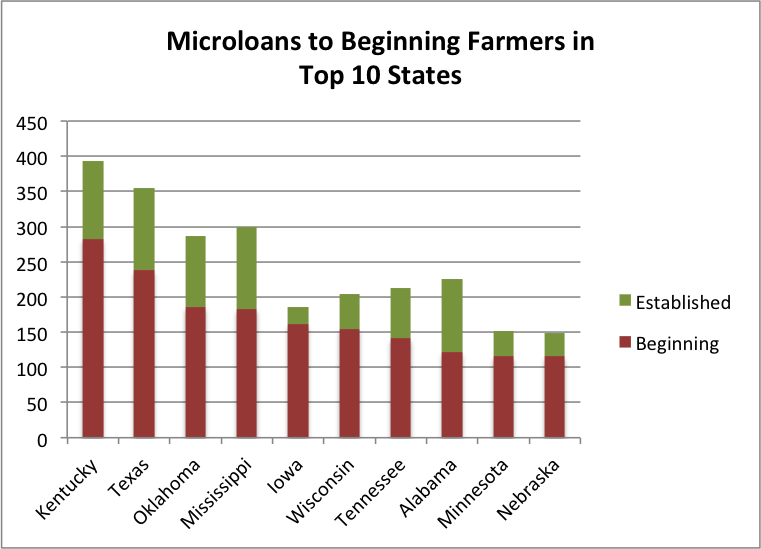
The vast majority of microloans made since the creation of the program last year were made to beginning farmers. 71 percent of all microloans made in 2014 totaling nearly $68 million went to beginning farmers, compared with 68 percent of microloans made last year.
The states that made the most microloans to beginning farmers closely follow the top microloan states in general with Kentucky, Texas, Oklahoma, and Mississippi all making 60 percent of microloans to beginning farmers in their states. These states also saw sizable increases in the number of loans to new farmers compared with last year. Hawaii, Kansas, Idaho, Louisiana, and Texas also saw significant increases in the number of microloans made to beginning farmers.
The states making the fewest microloans to new farmers include states that typically have smaller farming populations (like those in the Northeast) and states that have larger farms on average (like those in the West).
The microloan program in big ag states like South Dakota, Iowa, and Kansas is very much targeting new farmers, with over 80 percent of all microloans in these states going to beginning farmers. This is also the case in Idaho, and parts of the South, including Florida, Georgia and North Carolina.
Minority Farmers
In 2014, FSA made 45 percent more microloans to minority farmers than it did last year. However, despite the increase in the number of loans, the percentage of micro loans made to farmers of color remains roughly the same as 2013, or 17 percent. The states that made the largest number of microloans to minority farmers include states with overall larger populations of non-white farmers.
Texas and Oklahoma rank among the top two in the country in number of microloans to minority farmers, with 50 percent of microloans in OK and a third of those in TX going to farmers of color. These states both have large populations of largely Hispanic and Tribal communities, documented in the last Census of Agriculture as well as sizable farming populations in general, so it makes sense that these states are at the top of the list.
Several southern states that have historically large populations of African-American and also Hispanic farmers round out the list of states that prioritized microlending to minority farmers in 2014, including Alabama, Louisiana, Mississippi, and Florida.
There were twelve states that did not make any microloans to farmers of color in 2014, compared with 15 states last year. These states include primarily big ag states and Northeastern states that have some of the smallest minority farming populations such as Illinois, Iowa, and North Dakota in the Midwest and Vermont, Rhode Island, Delaware, Massachusetts, and Maine in the Northeast. It is somewhat surprising however that states like New York and Alaska did not make any microloans to minority farmers.
Women Farmers
In 2014, FSA increased the total number of microloans made to women farmers, but made a smaller total percentage to females compared to operations managed by males. In total, almost one in five microloans were made to women in 2014, with nearly 900 microloans totaling $16.4 million helping to finance female farmers’ operation expenses, compared to 764 microloans made to women last year.
The states making the highest percentage of microloans to women farmers include Alaska, Hawaii, Washington, Montana, Wyoming, and Arizona in the West, and Connecticut, Massachusetts, and Maine in the Northeast. These states follow the trends of those states with larger women-dominated farming operations, as documented in the most recent Census of Agriculture.
There were three states that made no loans to female operators – Rhode Island, Delaware and the Virgin Islands – compared to two last year. Great Plain and Southern states on average made fewer microloans to women farmers.
With higher than average percentages of microloans going to women farmers in the vast majority of states, the data shows that women are finding the new microloan program much more suited to their operations and specific farming needs. 77 percent of states and territories included in the data made more than 14 percent (the national average percent of female operators) of microloans compared with other FSA loans.
Veteran Farmers
In total, 360 microloans totaling $7 million reached veteran farmers in 2014, compared to 232 microloans to veterans last year.
States that made the most number of loans to veterans include Texas, Alabama, Mississippi, Tennessee, and Kentucky – which closely follow the states that made the most microloans in general. States with the highest percentage of microloans reaching veterans include Delaware, Colorado, Oregon, Puerto Rico, and Texas.
NSAC will continue to closely follow this program in the coming year, and work with our members and farmers across the country to better understand the reason for some of these trends at the local level.
Thank you for this excellent analysis! Really interesting and well presented.
Very interesting analysis especially at the tail end about states with proportionally low % of overall small loans compared to small farms numbers!!!
Hello,
This is a wonderful report. TY. Exactly what I was looking for. I wonder if you have any information about how repayment of these loans is going?
Thanks,
Dorothy Suput
Rural farmers will have something to boost them.