USDA NRCS TexasIn February 2022, the U.S. Department of Agriculture (USDA) first announced details of its Partnerships for Climate Smart Commodities (PCSC). The PCSC is a centerpiece of the Biden Administration’s strategy to help farmers and ranchers address climate change. In late 2022 USDA announced further details about projects, and more recently debuted the Partnerships Network. As the PCSC ramps up in earnest, now is an important moment to take stock of where the program stands in spring 2023.
Overview
The Partnerships hold both promise and unanswered questions. The potential of USDA’s largest ever investment in climate-smart agriculture is undeniable, yet the specific details of each Partnership project–from which practices are implemented on which acres and how well, to the types of farmers participating in each project–matter greatly, and remain unknown. As the Partnership projects launch in earnest throughout late spring and summer 2023, it’s unreasonable to expect this data to be available now. Yet it is absolutely imperative that USDA make this data publicly available in a timely manner so that stakeholders and taxpayers alike can evaluate the investments for themselves.
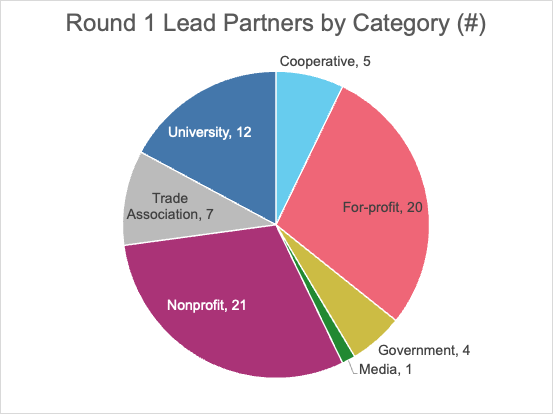
To date, the extent of publicly available project information comes from the project summaries released in September and December 2022, and the dashboard listing information for finalized projects–41 of them as of May 19, 2023. Although it’s possible to glean understanding from these sources, substantially more detail will be necessary to provide an in-depth analysis of the likely impacts of these projects. Most information within individual project descriptions remains unavailable due to USDA’s commitment to applicants to keep proprietary information out of the public eye.
Despite these limitations in our current understanding, there are nevertheless conclusions to be drawn from the data that is available. Throughout the remainder of this post–and in future analysis–NSAC will evaluate the available data, and ultimately the success of the Partnerships, based not only on their overall climate benefit, but the extent to which the Partnerships invest in small and midscale farmers, especially BIPOC farmers, and direct funds toward highly diversified, increasingly perennial systems. Such systems should be strongly influenced by indigenous and other traditional agricultural practices that inherently focus on creating highly biodiverse landscapes focused on food more than feed or fuel.
PCSC 101
The PCSC is divided into two rounds of funding, referred to by USDA as “pools”. Through the first round of grants, USDA prioritized proposals with high greenhouse gas (GHG) and carbon sequestration benefits. The second round prioritized equity and racial justice. Centering equity meant a focus on economic benefits for underserved (and other) producers, significant enrollment of underserved producers, and partnerships with environmental justice organizations, minority-serving institutions of higher education, and other organizations that “serve equity goals or represent small farmers.”
Roughly half of first pool recipients (29 at the time of the Partnership Network launch) have completed contracts with USDA and are beginning work. As of the publication of this post, those from the second round of funding are still negotiating their contracts with USDA. Both rounds of funding saw successful NSAC member proposals, including three projects on which NSAC members – the National Center for Appropriate Technology, Pasa Sustainable Agriculture, and Marbleseed – are leads. Fifteen projects include NSAC members as either leads or major partners.
Although USDA is treating much application information as proprietary and consequently the brief project summaries contain little information on the scope of the projects, the summaries do offer a sufficient sketch from which to draw some conclusions.
Distribution of Program Funds
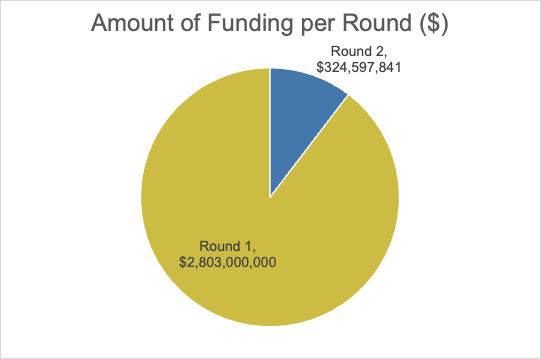
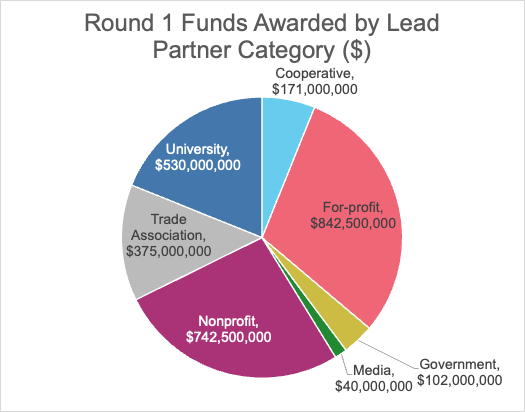
USDA distributed first-round funding across a variety of partners. Since any given project includes multiple types of organizations, this analysis will mostly focus on project lead organizations.
In the first round, lead partners included a number of for-profit organizations, including a few large, transnational corporations, and some carbon market verifiers whose carbon certification schemes sometimes rest on a shaky foundation. Among the nonprofit lead partners are several well-recognized, national environmental organizations, as well as a variety of other organizations that variously serve farmers, advocate for policy, or offer environmental services payments (Figures 2 and 3). A fuller list of descriptions of Round 1 partners is in Appendix 1, and for Round 2 in Appendix 2. The geographic distribution of currently active projects can be viewed via the USDA Partnerships dashboard. A count of projects in each round touching down in each state, region, or Tribal areas, can be found in Appendix 3 and Appendix 4.
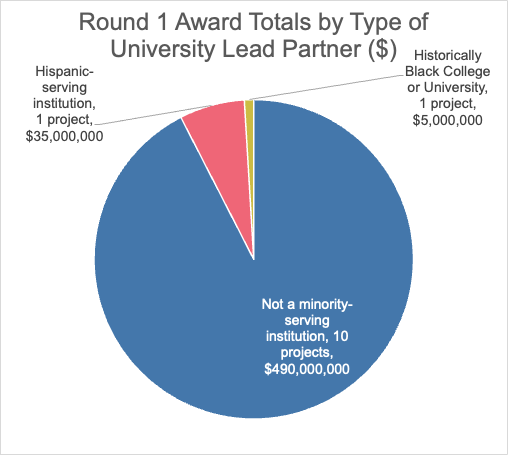
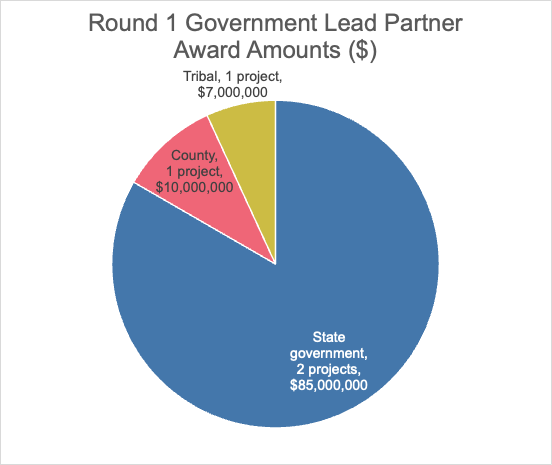
In breaking down some of the project categories, it is apparent that some account was taken for equity and racial justice factors in Round 1. Equity was a secondary evaluative factor in the first round. Among recipients were two minority-serving institutions of higher education and one Tribal government (Figures 4 and 5).
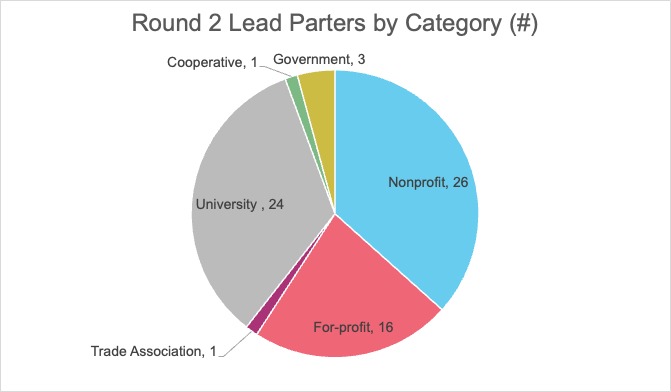
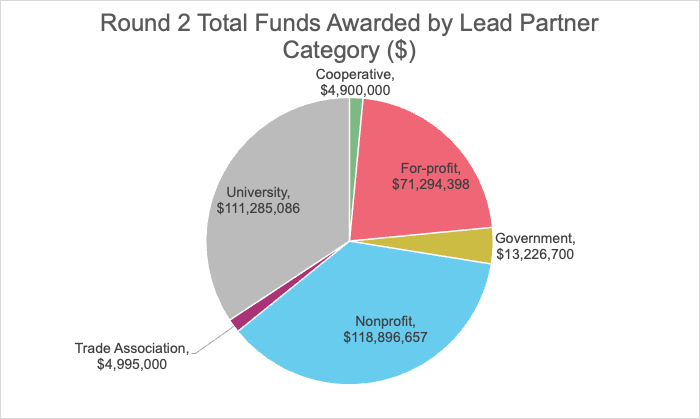
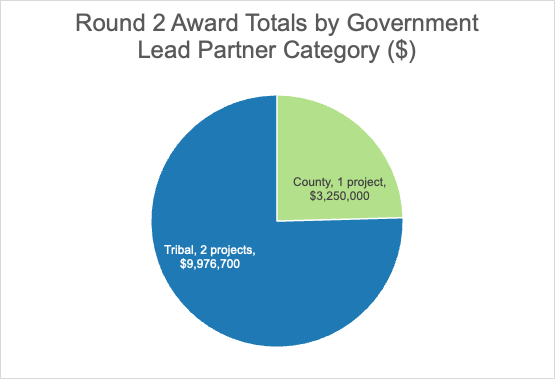
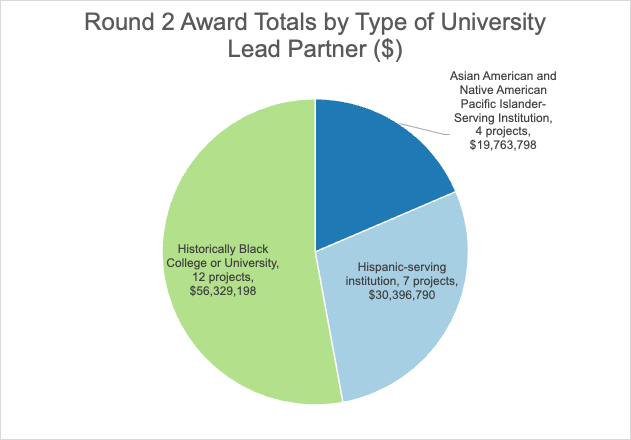
By comparison the distribution of lead partners in Round 2 looks fairly similar (Figures 6 and 7). However, the breakdown within the broader categories of lead partners reveals that the distribution of funds more clearly points to the second round focus on equity concerns (Figures 8 and 9).
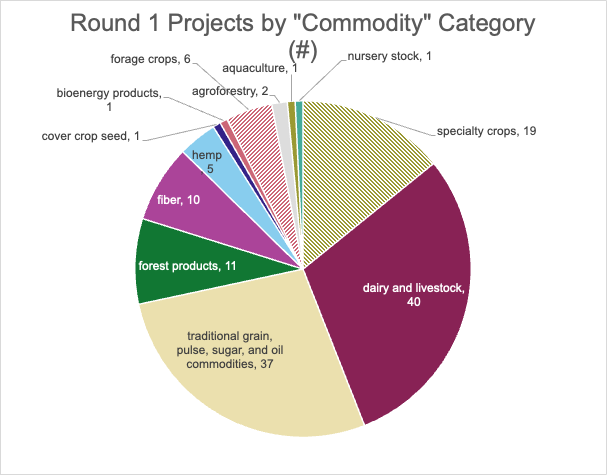
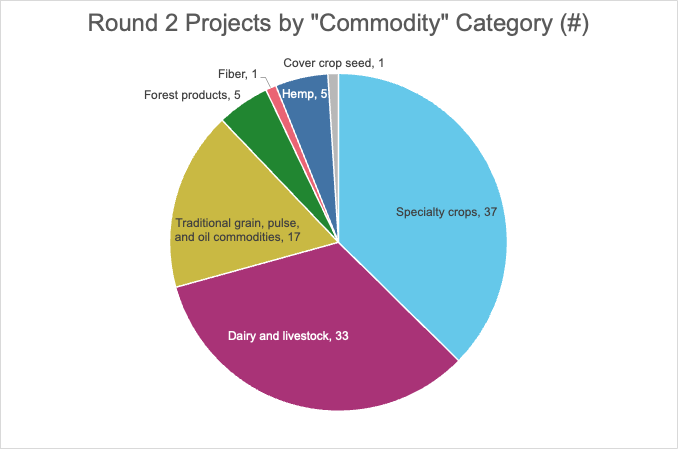
USDA expected proposals for the Partnerships to focus explicitly on the marketing of certain “commodities.” The Department left the definition of commodity wide open–anything grown on a farm counts. With the large grants awarded in Round 1, projects focused on a wide range of commodities, but more than half of the projects focused on dairy, livestock, or traditional grain, pulse, sugar, and oil commodity crops (Figure 10).
The biggest difference between the commodities in the first and second round was that Round 2 included more focus on specialty crops, with over a third including them as part of the project focus (Figure 11).
Another important difference between the first and the second round of funding was in the degree of participation by historically underserved farmers. In the first round, 13 projects mentioned some form of outreach to or participation by historically underserved farmers. In the second round of funding, 57 projects explicitly list underserved populations among their foci.
The focus on measurement and validation in Round 2 was also apparent, with 25 projects explicitly mentioning a focus on measurement, quantification, or validation. Only 15 projects in the first round discussed their measurement approaches as explicitly.
There was a strong focus on incentive payments for farmers in the second round, with 47 projects mentioning some form of farmer incentive payment. Round 1 included only 18 projects that mentioned farmer incentive payments in their summaries. There was also a stronger focus on technical assistance in the second round, with 34 project summaries mentioning it. Of Round 1 projects, only 16 mentioned technical assistance as part of their approach. By contrast, the first round had 39 projects that mentioned building up markets, and only 13 projects in Round 2 did the same.
One of the approaches that is likely to offer substantial benefits is a focus on building up networks among farmers and, in some cases, their broader networks, including consumers. Thirteen projects mention some form of network building, six in the first round and seven in the second round.
Although the Partnership is framed as a marketing program, it is, of course, intended to help farmers and foresters to reduce their greenhouse gas emissions and increase their carbon sequestration. The approaches described in the project summaries vary widely, but 15 projects overall mention cover crops (most in Round 2), and three projects focused on agroforestry. A number of projects discuss the conservation practices only in broad terms such as, “climate-smart agriculture practices,” “climate-smart grazing,” or “decrease greenhouse gas emissions.” However, others, such as the Rice Stewardship Partnership, specifically mention use of alternate wetting and drying cycles and furrow irrigation.
Because of the Partnerships’ focus on building out markets for climate-beneficial commodities, 52 projects mention some form of building or expanding markets, including 39 of the projects in Round 1. Eight projects also mention easing market access for participating farmers, with six of those in Round 1. Ten projects mention developing supply chains (5 in each round), and twenty-six projects discuss some form of branding, verification, or certification system as an element of their projects. That includes 20 projects in Round 2.
Further Concerns to Track During Contracting and Implementation
Once USDA begins to release data tracked from these projects, the greater level of detail on conservation practices used, the acres on which they were implemented, and the demographics of farmers that benefited most from them will be essential in determining the success of the Partnerships. Furthermore, from the list of data USDA intends to track, it does not appear that farmer demographic data such as historically underserved status will be available, which will make it especially difficult to judge whether the outcomes of the project serve USDA equity goals. However, it’s possible USDA may include this data in contracts. We strongly encourage USDA to commit to the public release of substantial data on these and related questions of how Partners spend taxpayer resources.
In addition, the application process did not require letters of commitment from organizations that project leads listed as part of the project, which has led to some instances of organizations surprised and mystified by their inclusion as a project partner. It is encouraging to hear that such letters are being integrated into the final contracts.
Launch of the Partnerships Network and Opportunities to Share Experiences
Among the goals of the Partnership for Climate Smart Commodities is for the participants to share ideas with each other, including implementation challenges and lessons learned. The Partnership Network had both a public and private kick-off event on April 27, 2023. The public event offered Secretary of Agriculture Tom Vilsack and Under Secretary of Agriculture for Farm Production and Conservation Robert Bonnie an opportunity to have two of the lead partners–the National Black Growers Council and American Forest Foundation–as well as the National Farmers Union, share their goals and outlook for the projects.
Meanwhile, the closed sessions were intended as an opportunity for Partnership Network members to get to know one another and share details of their experiences. NSAC hears that some Partnership participants discussed concerns about the level of paperwork required, and about the potential of bureaucracy to deter producer participation, especially among historically underserved farmers.
However, participants appreciated the opportunity to get to know one another and look forward to meeting in person in Denver in mid-June.
Closing
The Partnerships offer potential for conservation improvements as well as unanswered questions. NSAC hopes to see project outcomes that reflect both holistic conservation improvements and reversals of some of USDA’s legacy of fraught relationships with historically underserved producers. Finally, with the projects’ focus on market development, the new options that emerge will be of great interest, especially to organizations long involved in the work of organic certification.
Appendix 1: Round 1 Lead Partners Detailed Descriptions
| Cooperative lead partners description | Count | Award Amount |
| Milk marketing cooperative | 1 | $50,000,000 |
| Almond growers Cooperative | 1 | $45,000,000 |
| Dairy cooperative | 1 | $45,000,000 |
| Certified organic producers, mostly animal products | 1 | $25,000,000 |
| Sugar cooperative held by growers and shareholders | 1 | $6,000,000 |
| For-profit lead partners description | Count | Award Amount |
| Food Corporation’s Farmer Sustainability & Data Services | 1 | $90,000,000 |
| Agricultural data and reporting | 1 | $90,000,000 |
| Transnational food corporation | 2 | $150,000,000 |
| Biofuel or Biomass energy company | 3 | $140,000,000 |
| Carbon-focused agricultural consultancy | 1 | $70,000,000 |
| Ecosystem services focused, including carbon offsetting | 2 | $32,500,000 |
| Environmental science and technology company | 1 | $40,000,000 |
| Agronomic services | 1 | $30,000,000 |
| Rice miller | 1 | $45,000,000 |
| Grain-focused wholesaler, transporter, services | 1 | $40,000,000 |
| Seed corporation | 1 | $35,000,000 |
| Grassfed organic dairy | 1 | $20,000,000 |
| Produce company | 1 | $20,000,000 |
| Natural beef farmer | 1 | $15,000,000 |
| Low-carbon beef certifier and consultancy | 1 | $10,000,000 |
| No publicly available data beyond articles of incorporation | 1 | $15,000,000 |
| Government lead partners description | Count | Award Amount |
| State government | 2 | $85,000,000 |
| County | 1 | $10,000,000 |
| Tribal | 1 | $7,000,000 |
| Nonprofit lead partners description | Count | Award Amount |
| National environmental protection organization | 2 | $155,000,000 |
| Conservation District support | 1 | $90,000,000 |
| Membership-based agricultural network | 1 | $70,000,000 |
| Agricultural education and outreach | 1 | $30,000,000 |
| Sustainable agricultural education and resources | 1 | $55,000,000 |
| Organic research and education | 1 | $25,000,000 |
| Center for agriculture and environment | 1 | $35,000,000 |
| Environmental and racial justice policy advocacy | 1 | $35,000,000 |
| Conservation science, governance, and policy advocacy | 1 | $25,000,000 |
| Farmland protection and advocacy | 1 | $30,000,000 |
| Conservation science, governance, and policy advocacy | 1 | $10,000,000 |
| Nonpartisan diplomacy center | 1 | $20,000,000 |
| Social, agricultural, environmental development | 1 | $20,000,000 |
| Land conservation, community-informed development | 1 | $20,000,000 |
| Regenerative business accelerator, focus on carbon sequestration | 1 | $20,000,000 |
| Carbon offsets | 1 | $15,000,000 |
| Reforestation, food security | 1 | $7,500,000 |
| Forest carbon storage | 1 | $35,000,000 |
| Forest protection | 1 | $30,000,000 |
| “Accelerates economic capacity building” | 1 | $15,000,000 |
| Trade association lead partners description | Count | Award Amount |
| Farm Bill check-off program | 2 | $115,000,000 |
| State Dairy Checkoff program | 1 | $85,000,000 |
| Grain association | 2 | $145,000,000 |
| Produce and floral | 1 | $15,000,000 |
| University lead partner description | Count | Award Amount |
| Not a minority-serving institution | 10 | $490,000,000 |
| Hispanic-serving institution | 1 | $35,000,000 |
| Historically Black College or University | 1 | $5,000,000 |
Appendix 2: Round 2 Lead Partners Detailed Descriptions
| Cooperative lead partners description | Count | Award Amount |
| Specialty crop cooperative focused on perennial cover crops | 1 | $4,900,000 |
| For-profit lead partners description | Count | Award Amount |
| Carbon marketing company | 1 | $3,800,000 |
| Cattle company* | 1 | $4,467,000 |
| Cover, turf, and forage seed | 1 | $4,722,000 |
| Farms (4) | 4 | $13,870,199 |
| Farm services | 1 | $4,999,500 |
| Farmer-owned mutual aid and food access | 1 | $4,999,999 |
| Forest management | 1 | $4,800,000 |
| Hydroponic equipment vendor | 1 | $4,697,000 |
| Malt processor and supplier | 1 | $4,999,500 |
| Milling company | 1 | $4,999,700 |
| Plant-based single-use products | 1 | $4,940,000 |
| Supply-chain management | 1 | $4,999,600 |
| Vertical farming | 1 | $4,999,900 |
| Government lead partners description | Count | Award Amount |
| County | 1 | $ 3,250,000 |
| Tribes | 2 | $ 9,976,700 |
| Non-profit lead partners | Count | Award Amount |
| Support for Black row crop growers | 1 | $4,789,000 |
| Conservation District support | 4 | $18,094,000 |
| Western working lands education | 2 | $8,535,900 |
| Environmental protection | 1 | $4,999,997 |
| Farm certification, education, support | 1 | $4,935,000 |
| Farm certifier | 1 | $4,000,000 |
| Farm policy and education | 1 | $4,925,000 |
| Farmer legal and professional education | 1 | $4,926,300 |
| Farmer training | 1 | $4,770,000 |
| Farmer-led organic support network | 1 | $4,500,000 |
| Fiscal sponsor for progressive groups | 1 | $4,999,000 |
| Food hub, food & climate education | 1 | $4,999,900 |
| Land trust | 1 | $4,980,000 |
| Organic education and support | 1 | $4,407,000 |
| Peer network for Western landowners** | 1** | $14,997,660 |
| Regenerative stewardship and education | 1 | $4,633,900 |
| Rural community development | 1 | $560,000 |
| Tribal | 2 | $9,850,000 |
| Watershed restoration | 1 | $4,994,000 |
| Trade Association | Count | Award Amount |
| Farm Bill checkoff organization | 1 | $4,995,000 |
| University project lead partners | Count | Award Amount |
| Asian American and Native American Pacific Islander-Serving Institution | 4 | $19,763,798 |
| Hispanic-serving institution | 7 | $30,396,790 |
| Historically Black College or University | 12 | $56,329,198 |
Appendix 3: Round 1 Projects by State, Region, or Tribal Designation
| Project Locations | Count |
| Nationwide | 3 |
| Tribal | 14 |
| “Territories” | 1 |
| Alabama | 13 |
| Alaska | 0 |
| Arizona | 5 |
| Arkansas | 17 |
| California | 18 |
| Colorado | 14 |
| Connecticut | 4 |
| Delaware | 4 |
| Florida | 9 |
| Georgia | 15 |
| Hawaii | 3 |
| Idaho | 11 |
| Illinois | 12 |
| Indiana | 17 |
| Iowa | 15 |
| Kansas | 17 |
| Kentucky | 11 |
| Louisiana | 11 |
| Maine | 5 |
| Maryland | 11 |
| Massachusetts | 5 |
| Michigan | 12 |
| Minnesota | 17 |
| Mississippi | 12 |
| Missouri | 22 |
| Montana | 13 |
| Nebraska | 15 |
| Nevada | 2 |
| New Hampshire | 5 |
| New Jersey | 6 |
| New Mexico | 8 |
| New York | 15 |
| North Carolina | 15 |
| North Dakota | 14 |
| Ohio | 13 |
| Oklahoma | 13 |
| Oregon | 9 |
| Pennsylvania | 15 |
| Rhode Island | 3 |
| South Carolina | 12 |
| South Dakota | 15 |
| Tennessee | 16 |
| Texas | 18 |
| Utah | 4 |
| Vermont | 5 |
| Virginia | 13 |
| Washington | 11 |
| West Virginia | 6 |
| Wisconsin | 12 |
| Wyoming | 11 |
| Puerto Rico | 2 |
Appendix 4: Round 2 Projects by State, Region, or Tribal Designation
| Project Locations | Count |
| Nationwide | 2 |
| Tribal | 11 |
| Territories | 1 |
| Alabama | 8 |
| Alaska | 1 |
| Arizona | 6 |
| Arkansas | 7 |
| California | 9 |
| Colorado | 4 |
| Connecticut | 2 |
| Delaware | 1 |
| Florida | 7 |
| Georgia | 8 |
| Hawaii | 0 |
| Idaho | 1 |
| Illinois | 5 |
| Indiana | 4 |
| Iowa | 7 |
| Kansas | 4 |
| Kentucky | 5 |
| Louisiana | 3 |
| Maine | 1 |
| Maryland | 3 |
| Massachusetts | 5 |
| Michigan | 9 |
| Minnesota | 5 |
| Mississippi | 6 |
| Missouri | 7 |
| Montana | 3 |
| Nebraska | 3 |
| Nevada | 0 |
| New Hampshire | 2 |
| New Jersey | 3 |
| New Mexico | 5 |
| New York | 5 |
| North Carolina | 3 |
| North Dakota | 2 |
| Ohio | 4 |
| Oklahoma | 8 |
| Oregon | 4 |
| Pennsylvania | 3 |
| Rhode Island | 0 |
| South Carolina | 5 |
| South Dakota | 4 |
| Tennessee | 3 |
| Texas | 10 |
| Utah | 1 |
| Vermont | 3 |
| Virginia | 8 |
| Washington | 4 |
| West Virginia | 1 |
| Wisconsin | 4 |
| Wyoming | 1 |
| Puerto Rico | 1 |