Yesterday we examined statistics from the 2014 CSP sign-up period to illustrate how enrollment breaks down by state in terms of contracts awarded, acres treated, and funding obligated. To further understand what CSP looks like across the country, today we take a look at 2014 enrollments by the type of land treated, the crops produced, and the livestock raised. But first, a quick look at the top CSP states relative to the size of their agricultural acreage.
CSP Acreage as a Percentage of Total Farmland
Yesterday’s post showed the top CSP states in terms of total absolute acreage. While large agricultural states do enroll the most land and farmers and ranchers in CSP in absolute terms, when we look at that acreage as a percentage of a state’s total agricultural land in production, the numbers tell a different story. In many ways, this is the more interesting metric, as it reveals how CSP is faring relative to the size of the state’s agricultural sector.
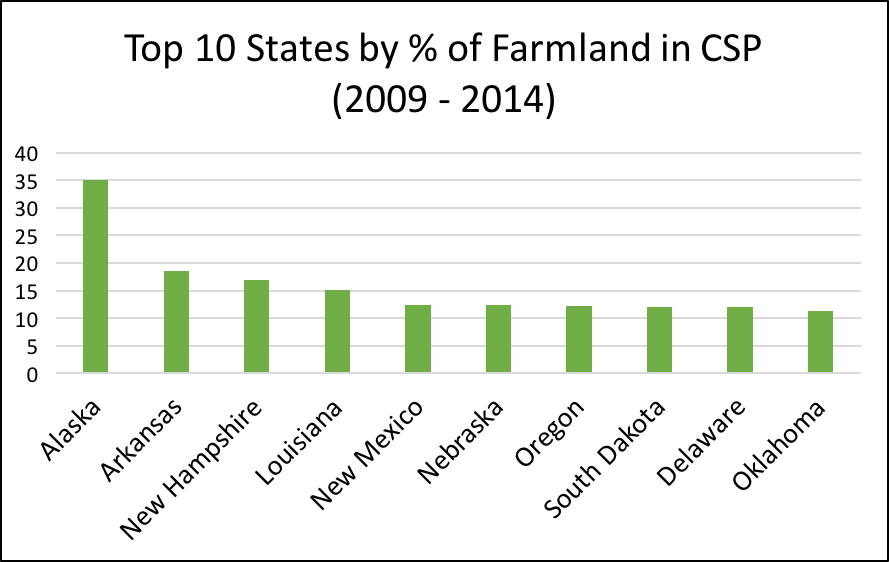
Between 2009 and 2014, Alaska enrolled an astounding 35% of its total agricultural land in CSP. Alaska’s 2014 enrollments increased this percentage from 21% of total agricultural land in 2013, though it should be noted that the majority of the state’s 2014 enrolled acres went towards contracts that were predominantly non-industrial forestland.
Ranking CSP acreage this way helps to highlight a different set of states that are taking advantage of the stewardship opportunities the program offers, supporting farms and ranches of a variety of scales throughout the country. While states such as New Mexico, Nebraska, South Dakota, and Oklahoma show up in the top ten whether by absolute or relative measures, other regions of the country such as the northeast (New Hampshire and Delaware) and the South (Arkansas and Louisiana) have states in the top ten when viewing the results as a relative measure, and that pattern continues as one goes down through the full list of 50 states.
CSP 2014 Sign-Up Data by Land Use
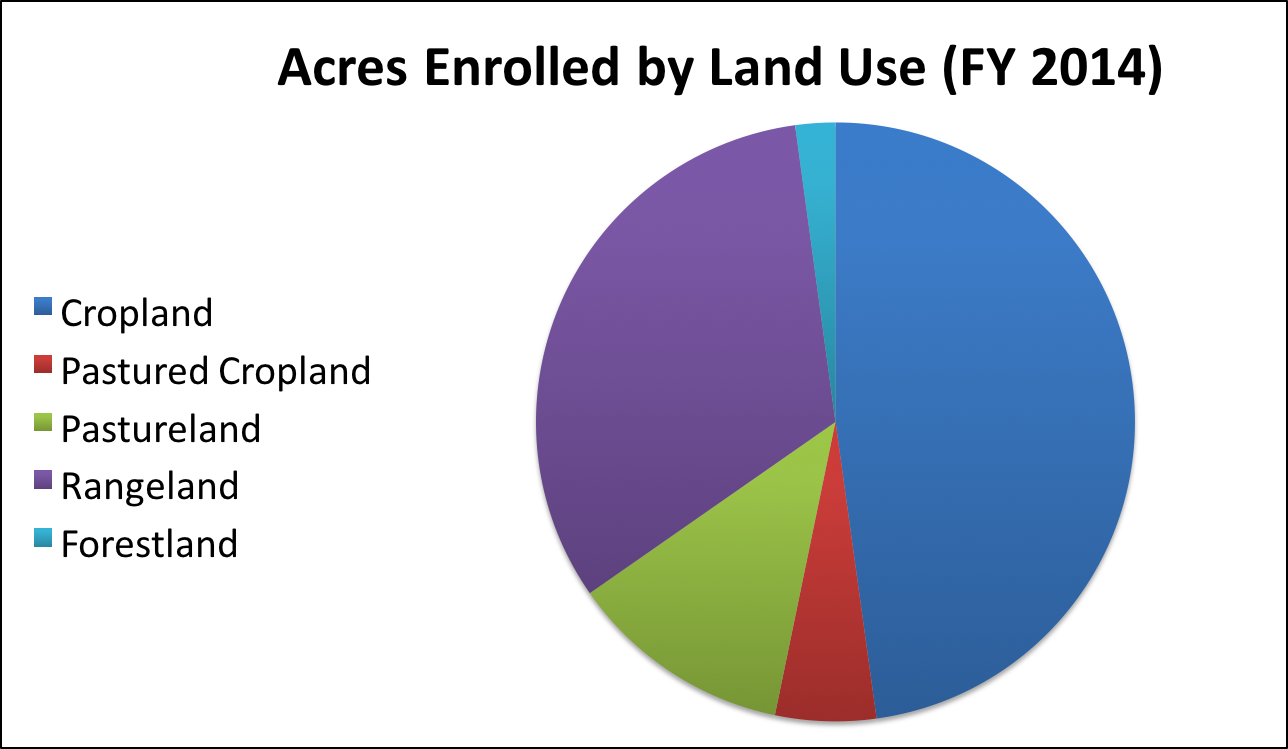
When farmers and ranchers sign-up for CSP they assign their particular acreage to at least one of four agricultural land uses: cropland, pastureland, rangeland, or pastured cropland (land designated as cropland but actually used for pasture). Non-industrial private forestland is also eligible but enrolled separately.
Farmers and ranchers often enroll multiple types of land within one contract, but unfortunately it is not possible based on the data NRCS provides to us to identify how the acreage breaks down within one contract, nor can we sum total counts of acres in each land use to return to total acreage enrolled.
Nonetheless, land use data still provides a valuable picture of the type of land that farmers and ranchers are supporting and improving through CSP. As the chart below illustrates, the majority of acres with conservation treatment under the 2014 CSP sign-up period were cropland and rangeland.
The breakdown of financial obligations by land-use does not perfectly mirror the distribution of acreage because the payment rates vary by land-use. CSP has a unique payment structure in that annual payments are set by the environmental benefits produced, multiplied by a standard land-use per acre payment rate.
For the 2014 sign-up period, the average payment for cropland was $17.23 per acre. This is the highest average payment rate for any land-use, and as a result cropland’s share of the financial pie is well over 50 percent of all funds obligated in 2014.
Pastured cropland and pasture had the next highest average payment rates, at $14.32 and $13.86, respectively. Rangeland received an average of $7.54 per acre, and forestland was $4.50 per acre.
The chart below highlights how funding was distributed by single land-use under the 2014 sign-up period.
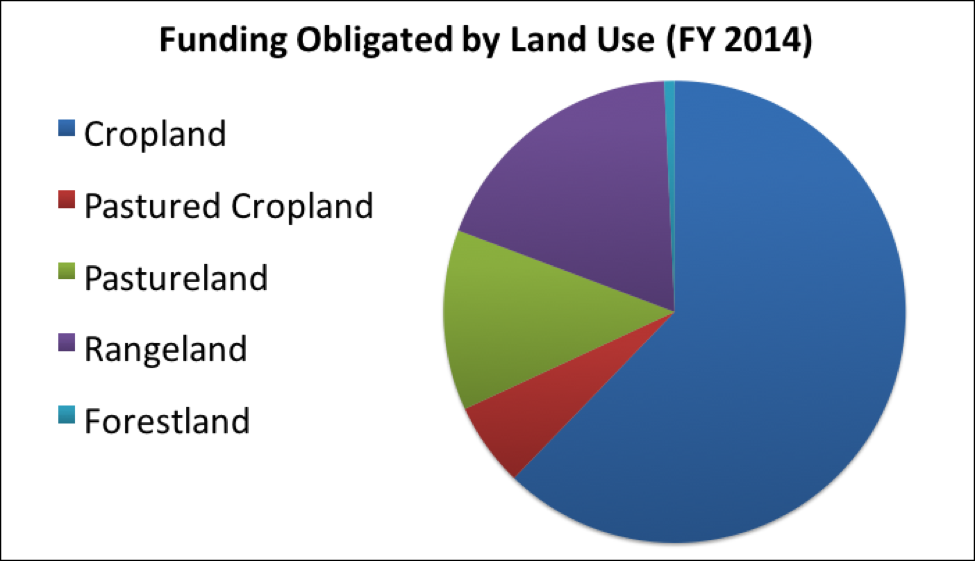
Though the data is limited since we cannot identify multiple land uses within a single contract, we can make the following observations based on single land use farms.
Among single land use farm, cropland made up 62 percent of new financial obligations in 2014 followed by rangeland at 18 percent, pastureland at 13 percent, pastured cropland at 6 percent, and nonindustrial private forestland making up 1 percent. For comparison, in 2012, 80 percent of new dollars were going to cropland, 14 percent to rangeland, 4 percent for pastureland, and 1 percent for forestland and pastured cropland each. Please note the caution, however, that many farms have cropland and pasture or pastured cropland, and those farms are not included in these numbers.
Although rangeland has increased from 14 to 19 percent of new obligations, the largest jump is among enrollment of pastureland that grew threefold from 4 to 13 percent.
In 2014, cropland accounted for 62 percent of financial obligations for new enrollments. For comparison, this value was nearly 80 percent in 2012, suggesting farmers and ranchers utilizing other land use categories besides cropland are taking more advantage of CSP recently than in the early years of the program.
The average dollars per acre by land use shifted from 2013 to pay more for rangeland ($7.54 in 2014, compared to $4.20 in 2013), but less for all other land uses. The most significant drops in dollar per acre average payment rates were in non-industrial private forestland and cropland, which changed by 40 and 30 percent respectively. It is not clear what caused the sudden drop off in cropland and forestland payment rates.
Interestingly, despite declining payments per acre for pasture and pastured cropland, enrollment is up for these two land-use types.
Land-use also differs by region. Among the states with the highest CSP acreage enrollments, there are differing patterns of land use that reflect their respective agricultural landscapes. For instance, acres enrolled in Minnesota, Arkansas, Kansas, and North Dakota were predominately cropland, while Texas and New Mexico enroll predominately rangeland. Montana, Nebraska, and South Dakota all have near equal levels of cropland and rangeland enrolled. Of these states, Oklahoma was the only one where pastureland and pastured cropland dominated enrollment.
CSP Contracts by Crops Produced
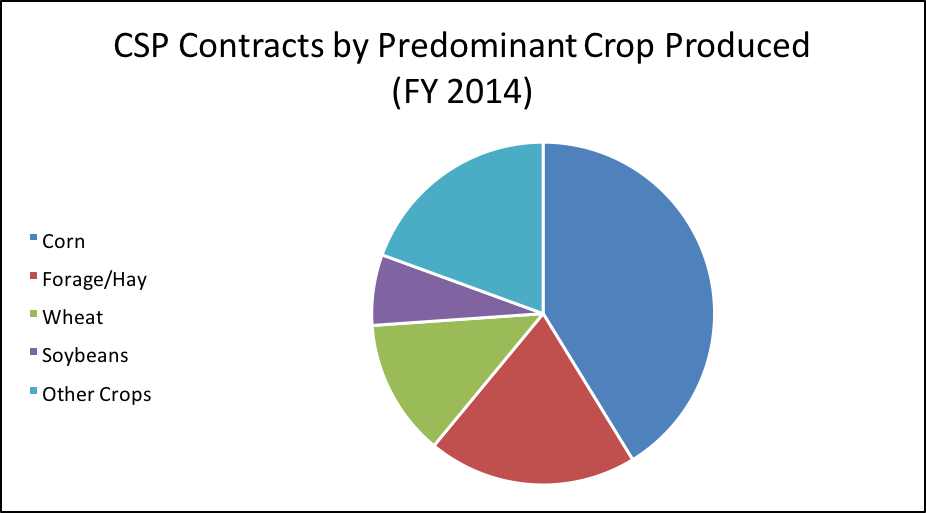
CSP contracts often include land with more than one type of crop in production, but NRCS is only able to track these contracts and their respective acreages enrolled by crop production in terms of the most predominant crop on any given farm. So a strong word of caution that the following statistics represent the crop that has the most acreage on a given farm, even if that farm might have multiple crops in rotation.
As was the case in previous years, farms that included corn, forage/hay, wheat, or soybeans as the predominant crop received the majority of CSP contracts enrolled in 2014. Together contracts that produced one of these crops as their predominant crop received 74 percent of all CSP contracts awarded to crop production in 2014. Other notable crops included soybeans, rice, cotton, and tree production.
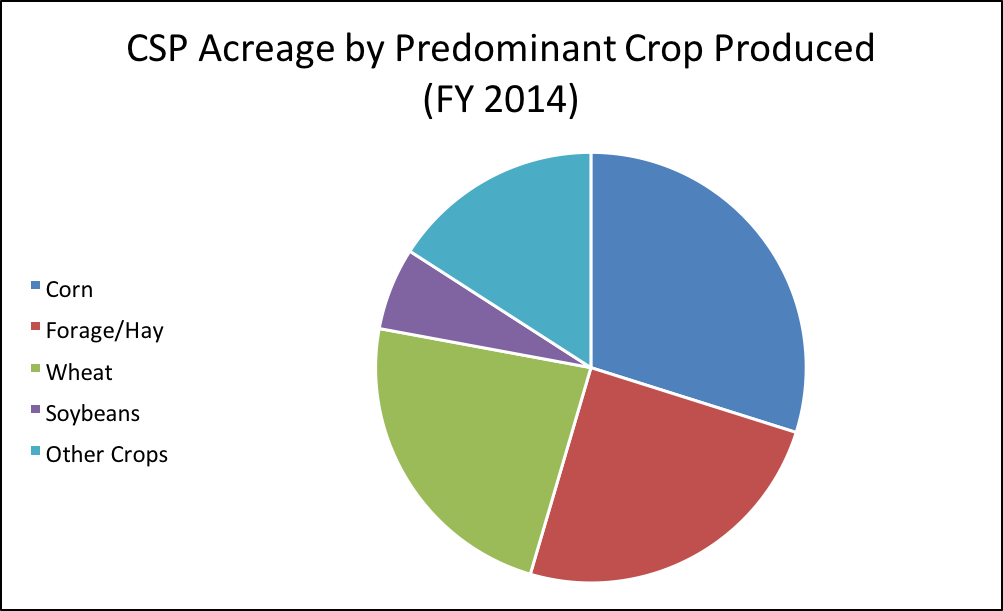
In previous years total acreage for forage/hay had exceeded that of corn. This year however, farms that predominantly produced corn not only had the received the highest number of CSP contracts, but as the chart below illustrates, they also covered the greatest amount of acreage (29 percent), just slightly higher than forage/hay, which covered 25 percent. The acreage for CSP farms that produce corn, wheat, or forage/hay as their predominant crop totals more than 6.5 million acres, or 78 percent of all crop-producing CSP acreage in the country.
Livestock
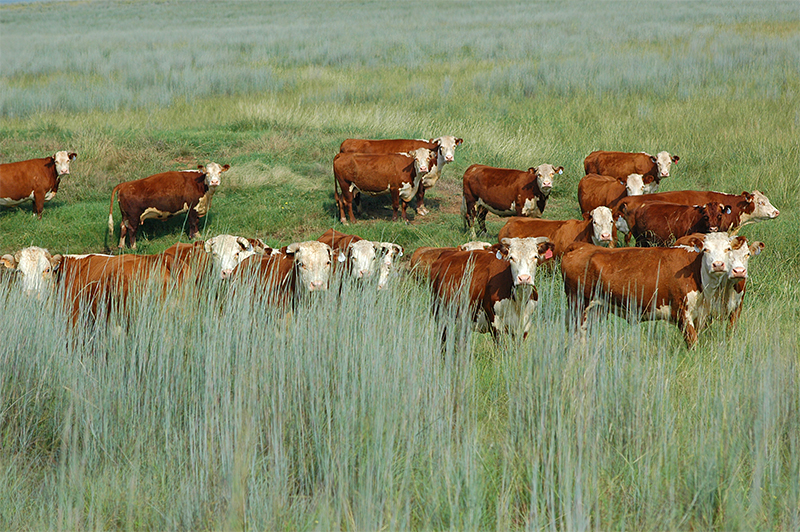
CSP contracts for livestock may include beef, poultry, bison, bees, horses, goats, turkeys, aquaculture, sheep, swine, dairy, and deer. Again, we are only able to provide information on the predominant form of livestock production for each contract and recognize that many operations raise a variety of livestock species. As the chart below illustrates, in 2014, 85 percent of all CSP contracts devoted to livestock production went to operations where beef cattle was dominant.
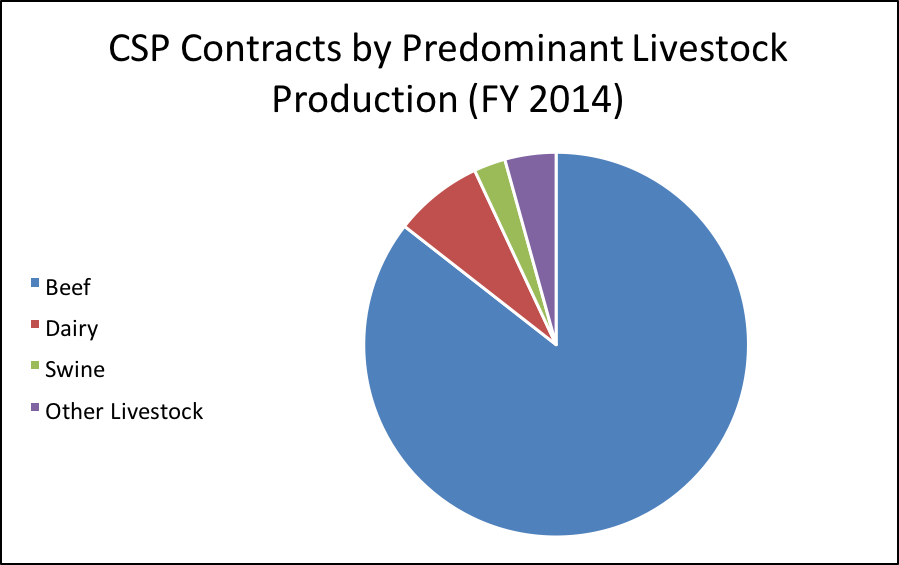
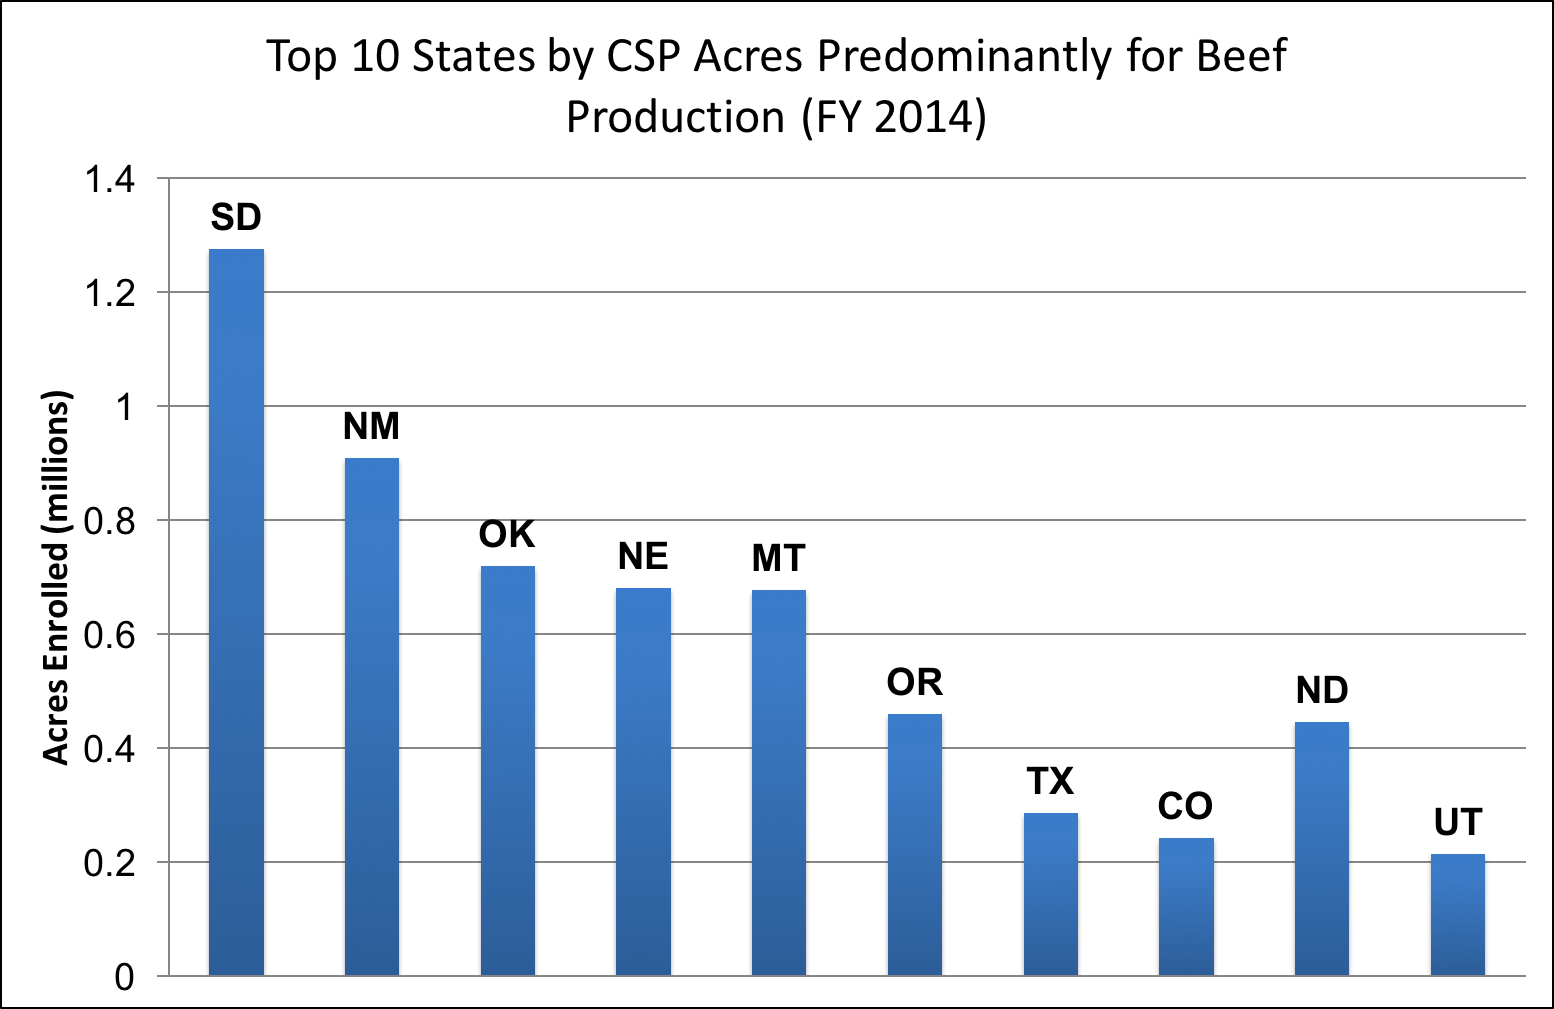
CSP acres devoted to beef cattle grazing as the predominant species encompass nearly 6 million acres, or 94 percent of all livestock acres enrolled in CSP in 2014. This pattern is consistent with acreage enrolled for beef production in previous years.
South Dakota contributed to 13 percent of all beef acres enrolled, over 1,000,000 acres, and made up 7.8 percent of contracts. New Mexico, Oklahoma, Nebraska, Montana, and Oregon all also made considerable contributions enrolling over a quarter million acres each.
Part four of this series will highlight CSP participation by beginning, socially disadvantaged and limited resource farmers and ranchers, as well as organic and transitioning to organic producers. We will dig into these numbers to examine trends in participation that are unique to these categories of CSP participants.