The Conservation Stewardship Program (CSP) is the nation’s largest conservation program by acreage and the only federal farm bill conservation program that requires a commitment to advanced conservation systems to participate. In this week-long blog series (parts 1, 2, 3, 4, and 5), we report on the progress that CSP has made in making land stewardship a financially rewarding endeavor for farmers and ranchers.
In late 2013, we published a series of three blog posts (Parts 1, 2, and 3) to provide an in-depth review of CSP data. USDA’s Natural Resources Conservation Service has recently released select data to the National Sustainable Agriculture Coalition on Fiscal Year (FY) 2014 enrollment. In this five-part blog series, we report on the progress that CSP has made in making land stewardship a financially rewarding endeavor for farmers and ranchers.
For background information on CSP, you can read the NSAC Grassroots Guide to Federal Farm and Food Programs. You can also read our Farmers’ Guide to the Conservation Stewardship Program or our 2015 CSP Sign-up Information Alert.
Conservation Stewardship Program Update – Part I
CSP is a working lands conservation program that provides comprehensive conservation assistance to farmers who actively manage and maintain their conservation efforts, expanding and improving on existing practices, and adding new conservation activities – all while keeping their land in production.
The CSP sign-up period is continuous throughout the year, but applications are ranked and entered into contracts once a year, and so applicants must submit before the each annual sign-up closes. CSP contracts last for five years with an option to renew the contract, and under the 2014 sign-up period, there were 9.6 million new acres enrolled in CSP, and an additional 17 million acres re-enrolled from expiring contracts from 2009 and 2010.
With these new enrollments and re-enrollments, as of the end of 2014, there are over 62 million acres of land enrolled in the Conservation Stewardship Program, making it USDA’s largest conservation program.
The 2014 Farm Bill requires that the U.S. Department of Agriculture (USDA)’s Natural Resources Conservation Service (NRCS) enroll 10 million acres of crop, pasture, range, and forested land into the Conservation Stewardship Program (CSP) each year.
CSP Basics
CSP provides financial assistance to farmers, ranchers, and foresters to produce food, feed, and fiber using advanced conservation techniques. Similar to the Conservation Reserve Program (CRP), CSP applications are ranked by the cumulative value of expected environmental benefits in a given contract. Unlike CRP, the CSP payment is based on the Environmental Benefit Ranking Score, not on local land rental rates. This also differs from the Environmental Quality Incentives Program (EQIP), which pays producers based on the costs to install a conservation practice.
Applications are assessed using the Conservation Measurement Tool, which takes into account the resource problems identified in a particular state or watershed. If a farmer meets a “stewardship threshold” and is thus eligible for the program, then she is entered into a competitive pool of applicants in that state. Contracts are awarded to those with the greatest value of environmental benefits in a given state until the state’s acreage allocation runs out. CSP contracts run for five years and may be renewed provided there is continual conservation improvement.
Over those six years from 2009 through 2014, NRCS has paid out or has committed to funding over $5.6 billion to producers across the country. The amount includes payments on all five-year contracts, as well as $945 million in funding committed to participants who renewed their contracts in 2014.
A Closer Look at the 2014 Enrollments
Priority Resource Concerns — State NRCS offices, with input from their State Technical Committees, are responsible for determining the priority resource concerns for CSP enrollment at the state, regional, or watershed level. Enrollees must then address the resource concerns specified within their contracts, meeting or exceeding the sustainable use or non-degradation levels on at least two priority resource concern at the time they enroll and at least one more by the end of the initial CSP contract period.
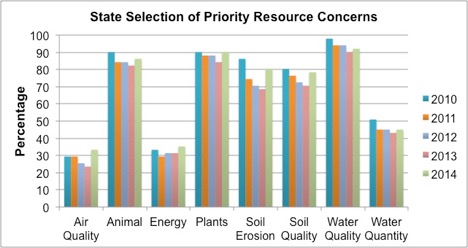
The chart above demonstrates the percentage of states that selected each of the priority resource concerns. The choices selected by the majority of the country (>75 percent) were, in order of popularity, water quality (92 percent), plants including biodiversity (90 percent), animals including wildlife habitat (86 percent), soil erosion (80 percent), and soil quality (78 percent).
The second tier of priority resource concerns selected includes somewhat more regionally specific concerns such as conservation of water quantity (45 percent) and energy (35 percent) as well as protecting air quality (33 percent). Air quality and energy conservation were chosen by a slightly higher percentage of states and watersheds in 2014 than in any preceding year.
Conservation Choices and Environmental Benefit Scoring — Financial incentives for the adoption of conservation practices are divided between two categories: regular conservation practices and conservation enhancements. The latter go above and beyond the requirements of regular conservation practices (e.g., using any cover crop versus using a high-residue cover crop for weed suppression and soil health, prescribed grazing versus intensive rotational grazing, or riparian forest buffer versus extending riparian forest buffers for water quality protection and wildlife habitat).
The program relies primarily on these conservation enhancements, but producers also can use the regular practices as needed to help them exceed the CSP stewardship thresholds to address additional priority resource concerns in their region.
NRCS publishes a list of activities eligible for CSP and assigns each enhancement an environmental benefit ranking score. These scores help determine whether an application will rank high enough to be selected for enrollment. They also factor into the calculation of how much a producer will be paid – the higher the score, the higher the payment. NSAC publishes an annual list of the enhancements in rank order by their conservation and environmental benefit score.
The assigned scores are based on the overall level of expected conservation and environmental benefits from the adoption of the enhancement for soil conservation, soil quality, water conservation, water quality, air quality, energy conservation, wildlife habitat, and biodiversity.
Excluding a few enhancements that are specific to expiring Conservation Reserve Program (CRP) acres, the highest scoring enhancement had an environmental benefit score of 84 points, while the lowest received a score of 5 points. The median score for the 74 enhancements offered in 2014 was 26.
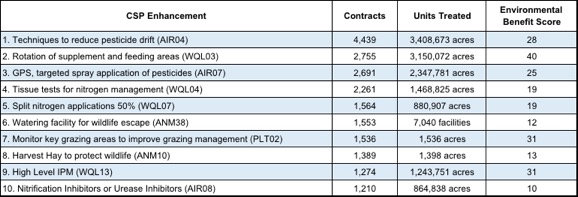
Conservation Practices and Enhancements Most Popular with Farmers and Ranchers — The top ten enhancements that participants selected in 2014 are listed in the table below. Pesticide and nitrogen management are some of the most commonly selected enhancements, as well as improved grazing methods and wildlife protection.
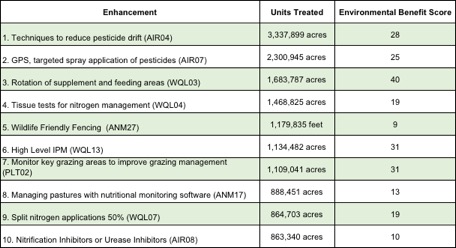
Enhancements can also be counted by units to incorporate number of acres or feet that are treated by a given enhancement. The top ten enhancements by units are similar to those by contract, again illustrating a high selection of nitrogen and pesticide management, responsible grazing, and wildlife considerations.
As the table below illustrates, there is a clear disconnect between the most commonly selected enhancements and the enhancements that receive the higher scores. Overall, only 3 of the most commonly selected enhancements were above the median score of 26 — rotation of feeding areas for livestock, grazing land improvement, and high level Integrated Pest Management (IPM).
Top 10 Most Commonly Selected CSP Enhancements (2014)
Most farmers sign up for multiple enhancements, so it is quite possible some of these commonly selected ones are signed up for in bunches or are used in combination with other higher scoring ones. We do not have the necessary data from NRCS to be able to make that assessment.
NSAC made recommendations to NRCS in 2014 on steps it could take to ensure a minimum environmental ranking score threshold for all CSP contracts, but NRCS did not act on that recommendation for the 2015 enrollment. We are again urging them to take that step for the 2016 enrollment.
Highest Scoring Enhancements in 2014 — We can flip the previous chart to instead look at enhancements in order of their environmental benefits, and, after again excluding those that award additional points for expiring CRP acreage, the top 10 scoring enhancements illustrate a continued disconnect between selection and environmental benefits. The table below shows the enhancements that were rated highest for their environmental benefits and how many acres were enrolled in 2014.
In comparing this table with the above ranking of the most commonly selected enhancements, we note that there is no overlap between the two lists. The highest scoring enhancement on the commonly selected list (rotation of livestock supplement and feeding areas) had a score of 40 points, while the high scoring top ten list cuts off after 44 points.
Of these top ten, the enhancement with both the highest use and the highest benefit score for 2014 was Intensive No Till, which had an Environmental Benefit Score of 62 and was used in 239 contracts (30th in all contracts) and 106,975 acres (27th in all acres). The next highest ones selected from among the top ten scoring enhancements were Resource-Conserving Crop Rotations and Intensive Cover Cropping.
Top 10 Scoring CSP Enhancements (2014)
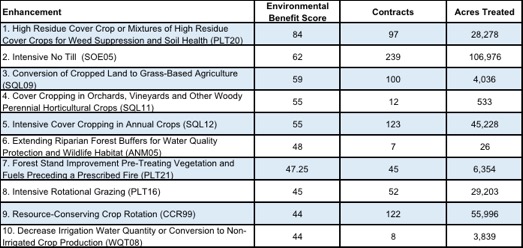
Of particular note on this list is the Resource-Conserving Crop Rotation (#9) enhancement, for which CSP provides a supplemental payment to producers, recognizing the multiple benefits that longer, more diverse crop rotations provide. Resource-Conserving Crop Rotations (RCCRs) can include cover crops, forages, or green manures, designed to reduce erosion, improve soil fertility and tilth, interrupt pest cycles, and help maintain soil moisture without additional irrigation.
In 2014, 122 CSP participants selected RCCRs as part of their contracts, covering nearly 56,000 acres throughout the country. The supplemental payment rate for 2014 (as well as for 2015) is $12 per acre, which ultimately fails to reflect the true investment of labor and management of farmers who diversity their rotations with the addition of resource-conserving crops.
RCCRs are 30th for usage in terms of contracts, a ranking that should be significantly higher given the environmental and financial incentives associated with the enhancement.
NSAC has submitted comments to NRCS on this issue multiple times, though as yet no action has been taken by NRCS to adjust the supplemental payment rate. We are again urging NRCS to increase the supplemental payment rate to $20 an acre for the 2016 enrollment.
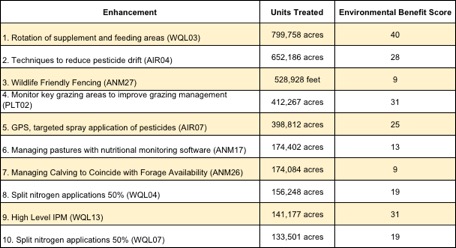
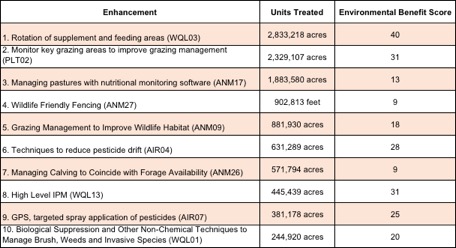
Enhancements by Land Use — The charts below take a closer look at the top ten enhancements, but this time shown separately for each land use type. Again, only a few of the most frequently chosen enhancements have relatively high environmental benefits, though as with the overall program data above, we cannot ascertain based on NRCS data how many individual CSP contracts are bundling multiple enhancements or what the total average conservation and environmental benefit score is per contract.
In Part 3 of CSP Blog Series we’ll further explore land use trends for CSP enrollments throughout the country, but the tables below illustrate the enhancements, and their corresponding environmental benefit scores, selected on cropland, pasture, and rangeland.
Cropland
Pastureland
Rangeland
Addressing the Disconnect Between Adoption and Environmental Benefits
Enhancements with the greatest potential for benefit are not as popular among participants as would be desirable. There are a variety of ways to address this concern, perhaps none more important than making the CMT and CSP planning more transparent to give CSP applicants better access to the choices they have to achieve their goals for higher levels of conservation performance. Reducing the number of low ranking enhancement choices or requiring a minimum threshold of enhancement points is also critical, as is increasing scores or payment rates for the top ranking enhancements. The establishment of the stewardship thresholds at high enough levels is also an important part of the program improvement mix.
NSAC has proposed all of these ideas to NRCS, and some improvements have been forthcoming over the past few years, though more are needed.
In the meantime, however, NRCS has decided to make major changes to the 2016 CSP enrollment (the 2015 enrollment is in process) that would create a substantially new ranking and payment system no longer based on the CMT. As that re-visioning takes place, linking the program more strongly to high ranking enhancements or bundles of enhancements should be a central consideration.
Part Two of the CSP Blog Series
In part two of this blog series, NSAC will report on more detailed CSP statistics from the 2014 sign-up period. This will include acres enrolled by state, closely examining how participation varies across the country in terms of the number of contracts and funding provided.
Part Three of the CSP Blog Series
In part three of the CSP blog series we will continue breaking down the data from the 2014 enrollment period, this time looking at the distribution of land use type, crops produced, and livestock raised on CSP acreage across the country.
Part Four of the CSP Blog Series
Part four of this series will highlight CSP participation by beginning, socially disadvantaged and limited resource farmers and ranchers, as well as organic and transitioning to organic producers. We will dig into these numbers to examine trends in participation that are unique to these categories of CSP participants.
Part Five of the CSP Blog Series
Part five of this series will build upon the data included in this week’s four posts, and provide an explanation of what’s at stake for CSP funding as the FY 2016 appropriations process continues.