There is no question that organic production is on the rise. Earlier this year, the U.S. Department of Agriculture (USDA) reported twelve percent growth in the organic sector between 2014 and 2015, the highest growth rate the sector has seen since 2008. However, given the diverse sets of data that make up this growth rate, it can be difficult to isolate rates for domestic organic farmers. In this blog, we dissect data from the Organic Integrity Database, which lists Certified Organic Operations from the past five years, in order to determine how domestic organic farmers have fared over the last few years.
The Demographics of Organic
Handlers are defined as all those that are certified to handle organic materials, but are not growing organic crops, gathering wild organic crops, or raising organic animals. Handlers are most commonly processors that are turning raw organic ingredients into value-added products, such as breads, cheeses, or sauces. 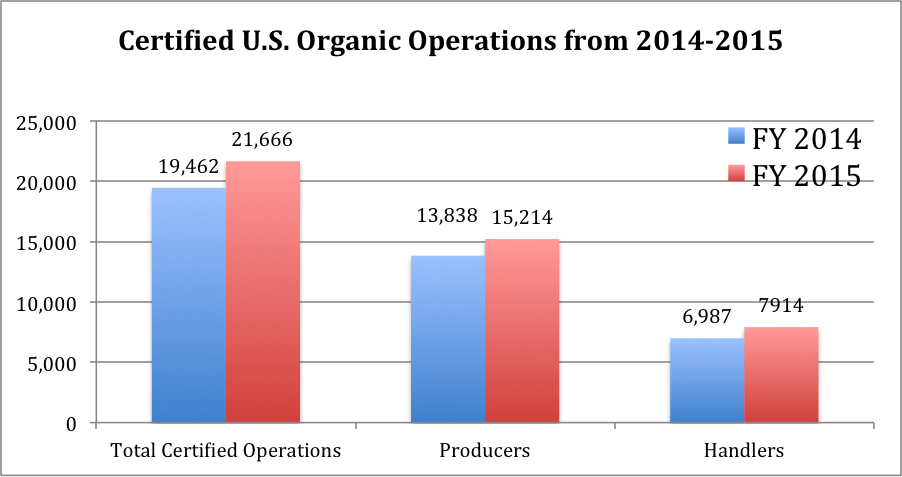
In 2014, there were 19,462 Certified Organic operations, including farmers and handlers, in the United States. Of those, 71 percent (13,838 operations) were certified as crop, livestock, or wild crop producers. The total number of certified handlers in 2014 was 6,987, with 1,365 of those handlers also engaged in some form of crop production.
In 2015, there were 21,666 certified organic operations in the U.S. (including farmers and handlers), an increase of 11.3 percent from the year before. Of those, 70 percent (15,214 operations) were certified as crop, livestock, or wild crop producers. From 2014 to 2015 organic producers increased by 1,376, or 10 percent. In 2015, the total number of certified handlers reached 7,914, an increase of 13.2 percent since 2014. Of those, 1,631 also engaged in some form of crop production.
While growth in the organic sector has been up on the whole, our analysis of the data indicates that from 2014-2015 growth was unevenly distributed between farmers and handlers. Given the ambiguities inherent in reporting production and handling sector growth as a single figure, we believe that more in-depth, specific analyses of organic production growth rates would provide valuable insights for farmers as well as for consumers.
Where are the Organic Farmers?
According to the latest National Organic Program (NOP), the top five states with the greatest number of certified operations (both farmers and handlers) in 2015 were concentrated in the Pacific Coast and Northeast regions of the United States. This ranking has remained similar over the years, indicating an entrenchment of organic farmers and handlers in these geographic areas:
| Top 5 States – 2015 | Total Operations | Farmers | Handlers | Livestock |
| California | 4,435 | 2,766 | 2,265 | 280 |
| Wisconsin | 1,619 | 1,381 | 278 | 676 |
| New York | 1,361 | 1,059 | 424 | 638 |
| Washington | 1,178 | 723 | 464 | 88 |
| Pennsylvania | 1,058 | 736 | 289 | 499 |
California led the nation in 2015, both in number of crop handlers and in number of farmers, by a large margin. Compared to the second and third highest states for organic handlers, Washington and New York, California led by nearly 1,800. The geographic location of organic processors and handlers influences the staple organic crops produced, and adds incredible economic support to regional farm economies.
When we look specifically at organic livestock production, however, the NOP data reveals a dominance of Mid-Atlantic and Midwest states. Wisconsin, New York and Pennsylvania are the top three states for livestock production over this period, with the top state, Wisconsin, leading California in operations by nearly 400. This disparity is likely due to the large number of organic dairy operations in these areas.
| States | Certified Organic Livestock Operations – 2015 |
| Wisconsin | 676 |
| New York | 638 |
| Pennsylvania | 499 |
| Ohio | 292 |
| California | 280 |
The Future of Organic Data
While current NOP data helps to identify where organic production and handling are consolidated geographically, it does not offer any substantial insight into the size and scope of the operations. Additional information on the acreage, herd size and yield of organic operations is necessary to estimate accurate growth rates in the organic sector.
The Organic Integrity database does currently contain some detailed information on crops, and we anticipate the level of detail available from the database should increase as NOP integrates data from the Organic Certifiers Survey into the database. This survey has been conducted for several years and was originally conducted by the Economic Research Service (ERS) until it was transferred to the National Agricultural Statistics Service (NASS) in 2014. NASS is now transferring the survey to the NOP in order to streamline the collection of information from certifiers, and to make the information more accessible by hosting it on NOP’s online portal.
While certifiers are not required to provide NOP with any information beyond basic operational data, we believe the information collected by the certifiers survey is critical to understanding the future of organics. NSAC encourages NOP to make a robust effort to integrate the certifier data into the Organic Integrity database as soon as possible.
Your article says that “the Organic Integrity database does contain some detailed information on crops and acreage”.
Can you tell me where the data on acreage is found within the Organic Integrity database?
Thank you.
Our apologies, the word “acreage” was mistakenly included in that sentence. The Integrity database provides crop information currently and should have acreage information when the certifier survey is included. You can use the following links to access crop and acreage information.
Organic Crop Information: https://apps.ams.usda.gov/integrity/Reports/DataHistory.aspx
Organic Acreage Information: http://www.ers.usda.gov/data-products/organic-production.aspx