When it comes to agriculture, revenue is only one of many important metrics in measuring growth and industry health. For the last two years, organic producers and consumers have cheered reports citing growth in sales revenue. According to the U.S. Department of Agriculture’s (USDA) 2016 Organic Production Survey, production rose 23 percent from 2016 to 2017; this is on top of the 12 percent increase the industry achieved from 2014 to 2015. With consumers increasingly interested in organic foods, it’s no small wonder that in recent years sales have steadily climbed (from $5.5 billion in 2014 to $7.6 billion in 2016). 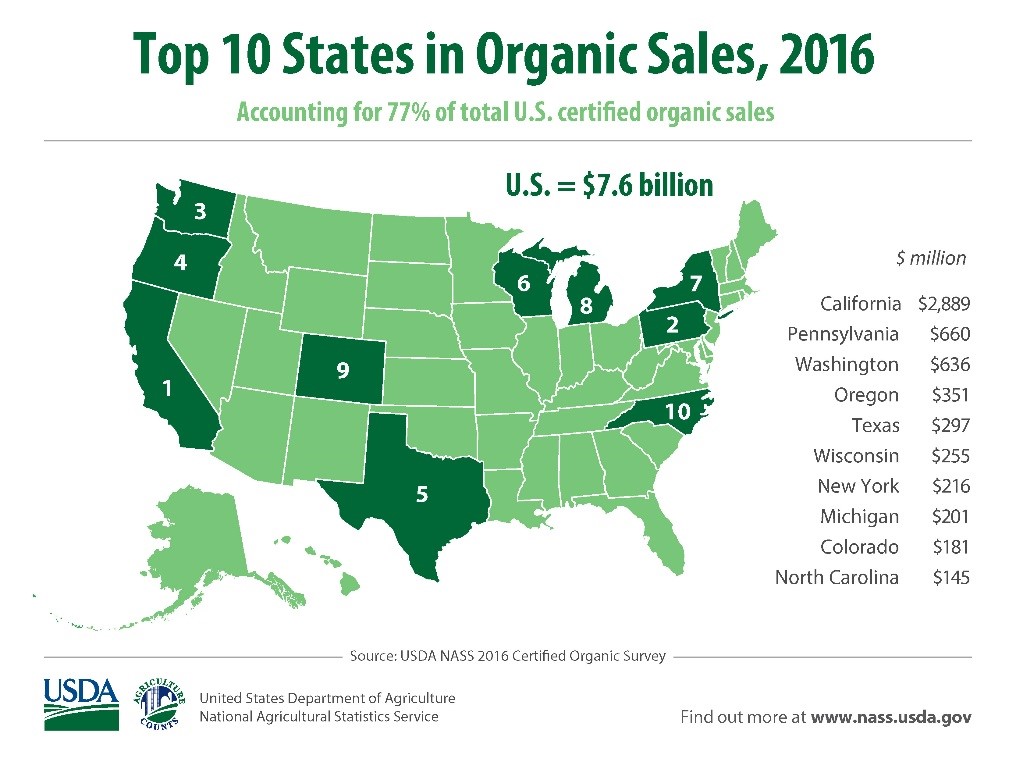
It is important to ask, however, are revenue figures the only relevant metrics for measuring industry health and growth? What about the total acreage of organic farms, or the number of total organic operations? In order to provide a better understanding of the state of organic agriculture (as well as the state of organic data collection), we have analyzed the results of the 2016 Organic Production Survey and identified where gaps in the data could cause potential challenges.
The 2016 Organic Production Survey
The annual Organic Production Survey is administered by USDA’s National Agricultural Statistics Service (NASS). While last year’s survey was similar in terms of sample size (roughly 15,000) and response rate (60 percent) to the 2015 survey, the 2016 survey itself was significantly shorter. The 2016 survey not only included fewer questions than the previous year’s, it also did not address several important issues, including transitional acres and the potential contamination of organic crops with unapproved substances.
The Ups and Downs of Organic Acreage
The number of organic acres in the United States has become an increasingly important issue as producers struggle to keep up with skyrocketing consumer demand. In 2016 alone, the U.S. imported over $1.5 billion in organic produce from 87 different countries in order to address domestic consumer demand. Some of these items, like bananas, are products that U.S. farmers do not produce at commercial scale. Other imports such as organic corn and soybeans, however, are already produced in the U.S., but not in large enough quantities to meet demand.
Despite growing consumer demand, the expansion of organic farms and organic acres in the U.S. has moved slowly. In September 2016, when the results of the 2015 Organic Production Survey were released, there was virtually no change in organic acreage between 2014 and 2015. NASS did report an increase during that year; however, a closer look at the data revealed that the entire increase was the result of the addition of a single, large livestock operation. In the 2016 survey, the data indicates a surprisingly large jump in organic acreage – from 4.4 million certified organic acres in 2015 to over 5 million acres of certified organic land in 2016 (a 600,000 acre increase).
While the NASS survey does not provide insights as to why acreage increased so sharply, it does show us where the increases occurred. Excluding Alaska, the top five states for organic acreage in 2015 – California, Montana, New York, Wisconsin, Oregon – remained at the top in 2016. While three of those states (MT, WI, OR) had a decrease in acreage between 2014 and 2015, all five experienced increases from 2015 to 2016. Rounding out the top ten list for 2016 were: Idaho (178,000 acres), Colorado (176,000 acres), Texas (146,000 acres) Vermont (134,000 acres), Minnesota (130,000 acres), and Wyoming (119,000 acres).
| State | 2014 Acreage | 2015 Acreage | 2016 Acreage | 2015-16 change |
| California | 685,848 | 790,413 | 1,069,850 | +279,437 |
| Montana | 317,878 | 251,531 | 266,048 | +14,517 |
| New York | 210,871 | 238,700 | 264,385 | +25,685 |
| Wisconsin | 226,056 | 209,615 | 219,266 | +9,651 |
| Oregon | 203,555 | 175,675 | 194,769 | +19,094 |
California experienced the largest increase in acreage (279,437), mostly thanks to expanded pasture and rangeland – only about 18,000 acres of new organic cropland were added in the state from 2015 to 2016. The acreage increase in California makes up nearly half of the total national increase between 2015 and 2016.
In Texas, the addition of roughly 60,000 acres represented the second largest increase of all states, though the state did not make it on to the top 10 list in terms of total organic acres. One might suspect that the 60,000-acre increase would be attributed to the addition of large tracts of pasture land, but in fact two thirds of those acres (40,000) were categorized as cropland.
Other notable increases include 40,000 acres added in New Mexico, and 20,000 acres added in Mississippi. While several other states experienced increases similar in size to Mississippi’s, theirs is especially notable because it represents a nearly seven-fold increase from 2015.
Acreage increases were not confined to the top ten states with the most acres, however. Forty two of the 50 states experienced increases in reported organic acreage in 2016, according to NASS.
Difficulty in Tracking the Number of Organic Farms
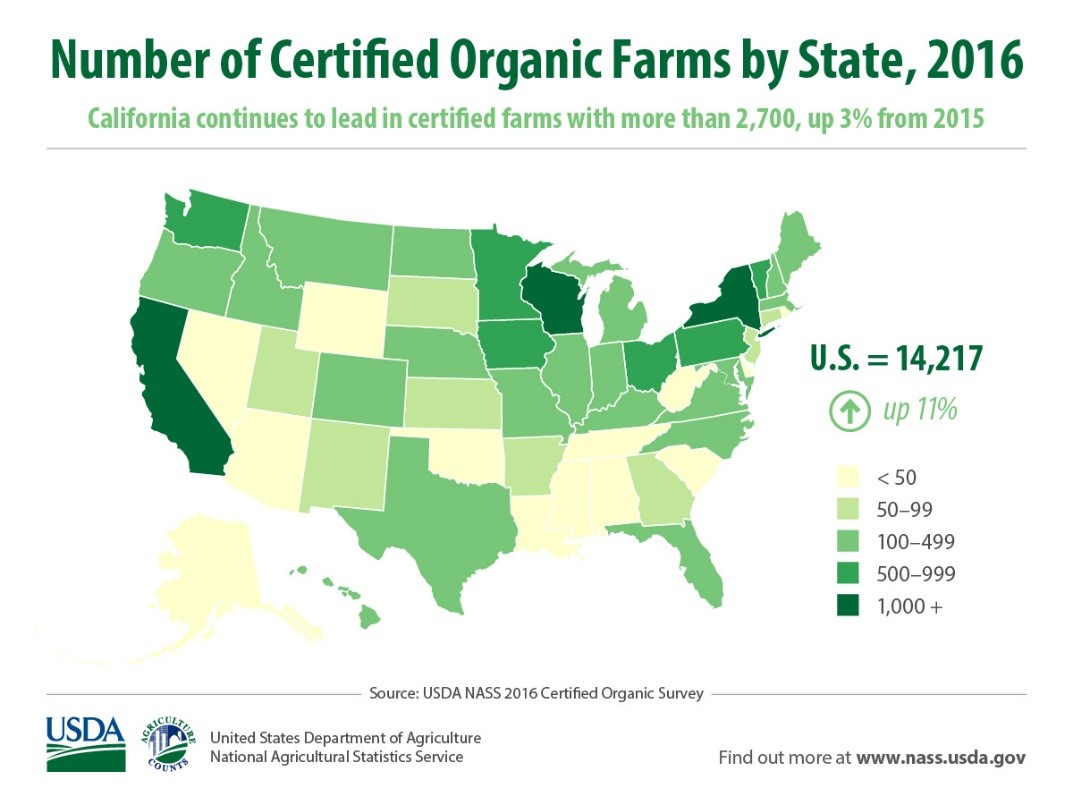
Farms come and go from organic certification throughout the year, which makes keeping an accurate count of the number of organic farms at any given time challenging. The nature of getting an accurate count for this metric is perhaps one of the reasons there is such a large difference between the number of certified organic operations reported in the Agriculture Marketing Service (AMS) Organic Integrity database and the number reported by the NASS survey. Currently, AMS’ database shows 17,181 certified organic operations. The NASS survey, in contrast, reported only 14,185 certified organic farms. Part of this discrepancy is likely also due to the difference in methodologies between NASS and AMS. The NASS survey is weighted to account for their 60 percent average response rate, whereas the AMS database attempts to track every single organic operation.
Future of Organic Data Collection
USDA has conducted six surveys of organic producers since 2007:
| Crop Year | Fiscal Year | Survey Status | Survey Type |
| 2008 | 2009 | Completed | 2007 Census Special Study |
| 2011 | 2012 | Completed | Certified Organic Production Survey |
| 2012 | 2013 | NA | NA |
| 2013 | 2014 | NA | NA |
| 2014 | 2015 | Completed | 2012 Census Special Study |
| 2015 | 2016 | Completed | Organic Production Survey |
| 2016 | 2017 | Completed | Organic Production Survey |
| 2017 | 2018 | Upcoming and Funded | Census of Agriculture |
As many have reported, the 2016 data show that organic production has continued to grow, both in terms of acreage and revenue. In fact, in response to growing consumer demand, these numbers have steadily increased over the last three years, not just in 2016. Given the premiums generated for farmers and the strong interest by consumers, we expect this upward trend to continue. Nonetheless, due to a lack of consistency in methodology and survey questions, these surveys have some limitations that make it difficult to assess certain indicators over time. In the future, USDA should focus on better coordinating methods and survey questions so that at least three years of comparable data can be collected.
Agree, all data must take an integrated look at the whole industry from farm , crop/livestock, areas and number of operations essential.
Thank you