Yesterday we examined data from the 2014 Conservation Stewardship Program (CSP) sign-up period in terms of the agricultural landscape, examining the types of land enrolled, crops produced, and livestock raised. Today we break down CSP participant numbers to highlight particular groups of farmers and ranchers enrolled, with a focus on the groups that stand to significantly benefit from the additional support for their stewardship efforts.
For CSP to truly encourage conservation across a diverse agricultural landscape, it must be accessible to farmers of any experience level and farms of any scale or production system.
To get at this critical objective, we take a look at CSP participation trends for beginning and socially disadvantaged farmers and ranchers as well as organic and transitioning-to-organic farmers across the country. We also look at the distribution of contracts by funding amount, in order to determine how well CSP is serving farms and ranches of a variety of scales.
As we have previously reported in Parts 1, 2, and 3 of this series, CSP rewards farmers, ranchers, and foresters for how they grow what they grow. There are currently more than 62 million acres enrolled in enhanced conservation through CSP.
This is the fourth part of a five-part series, and tomorrow’s final post will take a closer look at the how the appropriations process stands to impact funding levels for CSP.
Beginning and Socially Disadvantaged Farmers and Ranchers
The National Sustainable Agriculture Coalition (NSAC) pays particular attention to how federal programs impact beginning farmers and ranchers and socially disadvantaged producers across the country. Access to conservation programs is especially important for these groups, because the next generation of producers, as well as those have been historically disadvantaged, need to have ample resources to establish themselves of good stewards of the land and effective conservationists.
In order to get at this underlying objective, we examine how CSP has been used by these groups of farmer and ranchers, and compare their participation to the general population enrolled in the program.
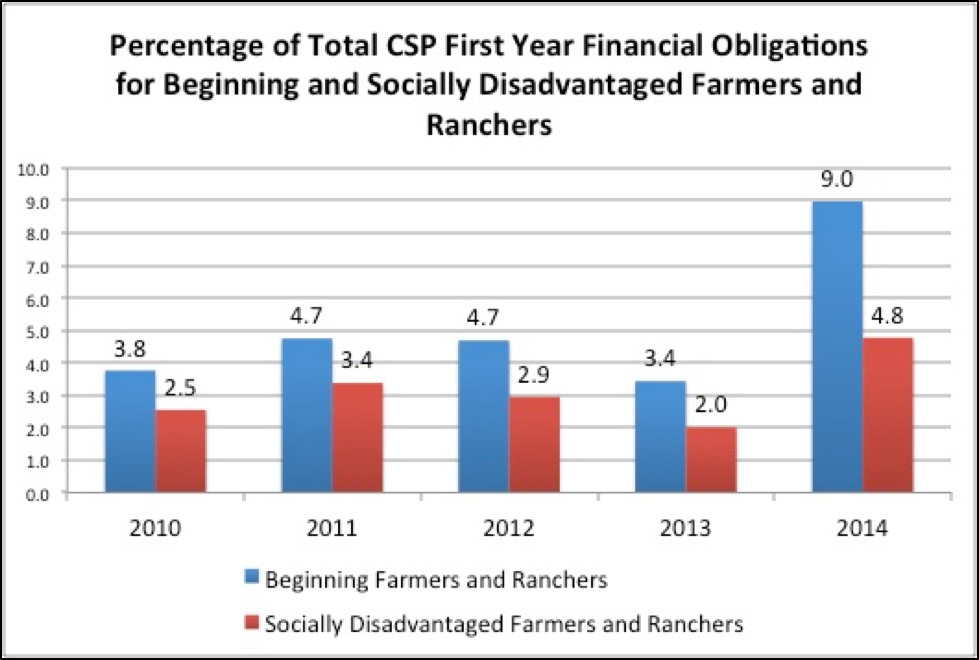
The graph below illustrates the percentage of CSP acres that went to beginning farmers and ranchers between 2010 and 2014. The 2008 and 2014 Farm Bills require USDA’s Natural Resources Conservation Service (NRCS) to set-aside 5 percent of acres enrolled in CSP to be made available for beginning farmers and ranchers, and another 5 percent of acres for socially disadvantaged producers. These two pools of applicants then compete for funding amongst other beginning or socially disadvantaged farmers, but not with applicants as a whole – thereby increasing their changes of securing a CSP contract.
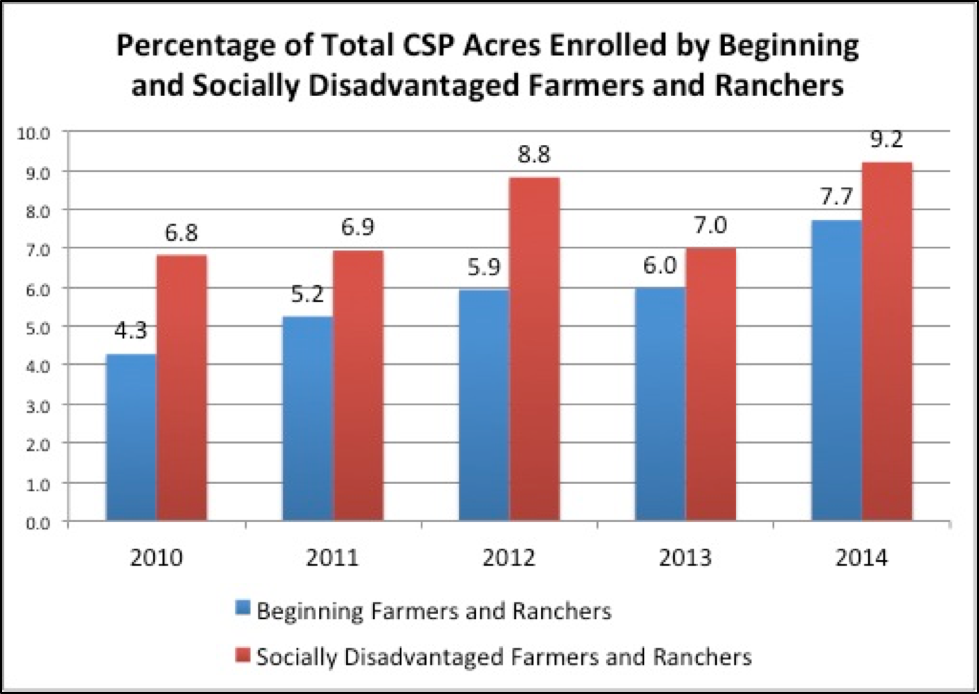
As the graph above illustrates, except in for 2010, USDA has exceeded the set-aside requirements every year. In 2014, beginning and socially disadvantaged farmers and ranchers enrolled 7.7 percent and 9.2 percent of total CSP acreage, respectively.
NSAC commends USDA for its progress in fulfilling these critically important Congressional mandates to support beginning and socially disadvantaged producers, but there is still much more that can be done to level the playing field to ensure access to conservation funding.
Given that beginning farmers represent over 17 percent of farms and 25 percent of all farmers in the country, there remains significant work to be done to ensure that these trends are reflected in CSP enrollment. One way to address this concern is to establish an agency goal of at least 15 percent of all CSP acres set-aside for beginning farmers and ranchers. NSAC has recommended this increase to NRCS, and we hope to see a change reflected in the CSP final rule this summer.
To further put beginning farmer CSP enrollment numbers into perspective, the Environmental Quality Incentives Program (EQIP), an NRCS program that provides farmers and ranchers with financial cost-share and technical assistance to implement conservation practices on working lands, has much higher beginning farmer participation numbers than CSP.
EQIP has the same set-aside for beginning farmers and ranchers, and in 2014, 10 percent of all treated EQIP acres went to beginning farmers and ranchers, well above the percentage of CSP acres enrolled for this group. Given this contrast, there is even more NRCS can do to make CSP work for beginning farmers and ranchers.
The chart below highlights how contracts break down by year for beginning and social disadvantaged farmers and ranchers, illustrating a steady increase in the percentage of total producers enrolled for each group.
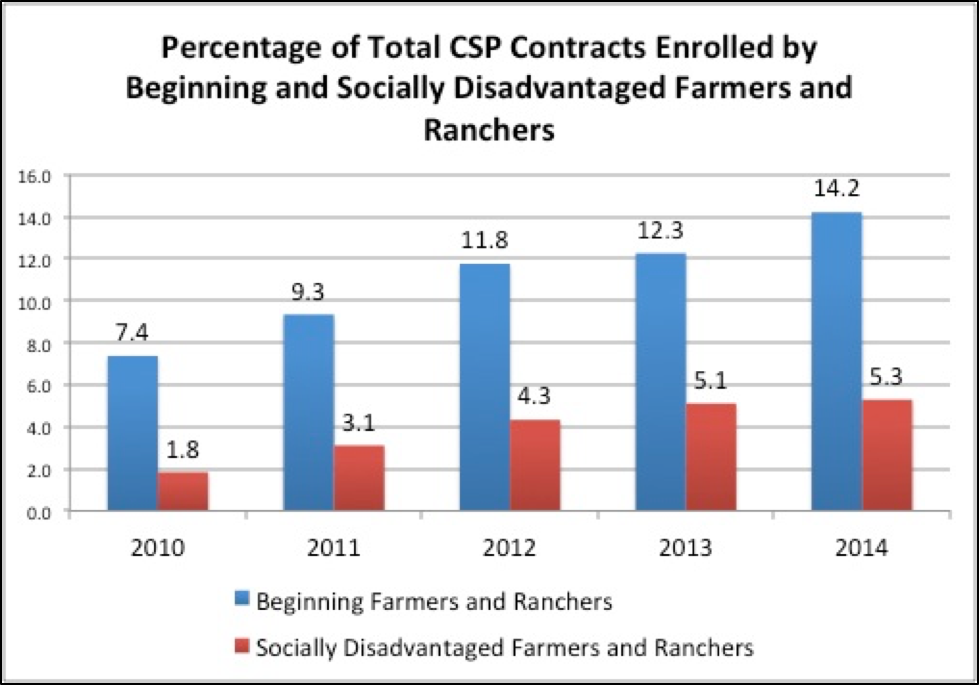
We can also look at the distribution of CSP contracts for these groups in terms of funding allocation. Despite the fact that socially disadvantaged farmers and ranchers enrolled more land into CSP than beginning farmers and ranchers, the amount of CSP funding obligated to them is significantly lower, as illustrated in the chart below.
Comparing the three charts, two things stand out in particular. Beginning farmers are enrolling farms that are, on average, slightly more than half the size of those enrolled by non-beginners. Socially disadvantaged farmers are receiving payments per acre that are, on average, just over half the average payment per acre rate for non-minority farms.
That beginning farmers have smaller farms is not surprising. Why payment rates are low for socially disadvantaged farms is not clear from the limited data we have from NRCS.
Breakdown by State
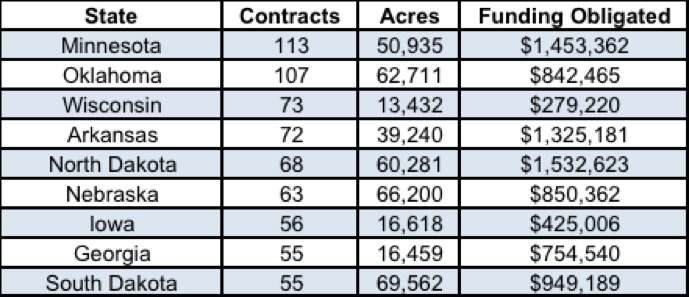
Beginning and socially disadvantaged farmer and rancher participation in CSP varies significantly state to state. The following tables show the top ten states by contracts awarded to beginning and socially disadvantaged farmers and ranchers in 2014. Many of these top states for beginning farmer and rancher contracts also fall among the states with the highest overall enrollment numbers.
Top 10 States by Beginning Farmer and Rancher CSP Contracts
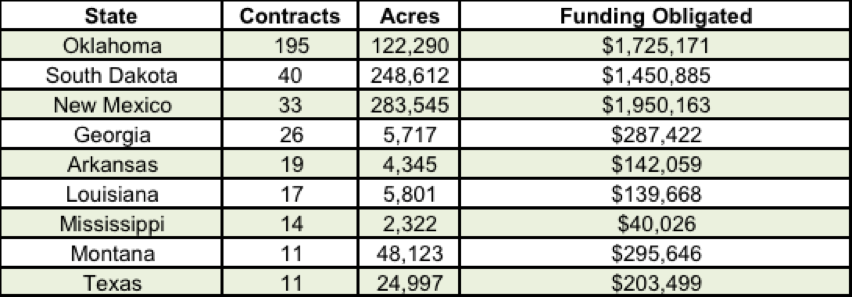
Top 10 States by Socially Disadvantaged Farmer and Rancher CSP Contracts
Given that states vary significantly in the total numbers of CSP contracts and acreage enrolled, it is valuable to also consider beginning farmer participation through the metric of the percentage of total acres enrolled that are managed by beginning farmers or ranchers.
The table below highlights the states with the greatest percentage of total CSP acres going to beginning farmers and ranchers between 2010 and 2014.
Top 10 States by Percentage of CSP Acres Enrolled by Beginning Farmers
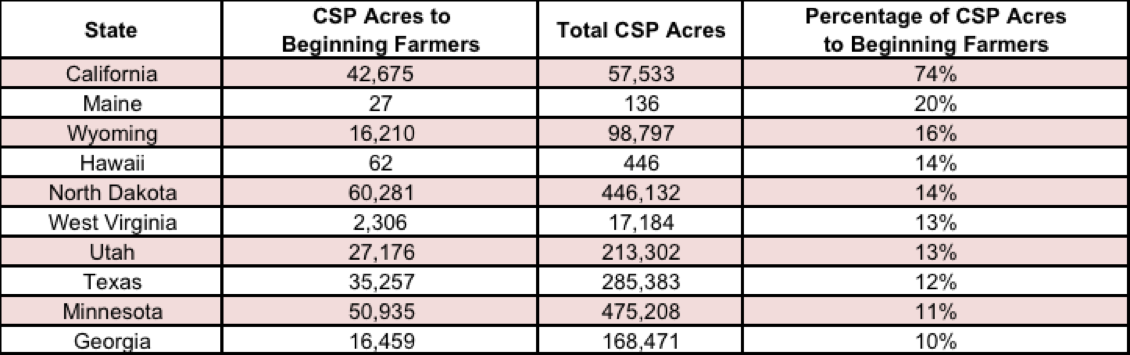
Despite the fact that California’s overall CSP participation is low in proportion to its size and overall agricultural production, it is promising that nearly three quarters of their total CSP acreage has gone to beginning farmers and ranchers.
Certified Organic and Transitioning to Organic: CSP Participation
Conservation is central to organic agriculture, and organic and transitioning producers encounter unique opportunities and challenges in using CSP. Certified organic production is growing rapidly in the Unites States, in 2013 accounted for approximately 1 percent of all U.S. agricultural land.
NRCS tracks CSP acreage for certified organic producers, as well as participants who are in the process of transitioning to certified organic production. Both groups of farmers and ranchers face a unique set of challenges and opportunities in their conservation efforts, which can be addressed through the adoption and ongoing management of specific CSP enhancements.
As a percentage of total CSP acreage, certified organic CSP acres lag behind the national figure, with 0.29 percent of CSP acres certified as organic in 2014. This is down from 0.34 percent in 2012. In this analysis of organic CSP data, however, we combine certified organic and transitioning to organic CSP acres. In doing so, the total percentage of organic CSP acres is 0.57 percent.
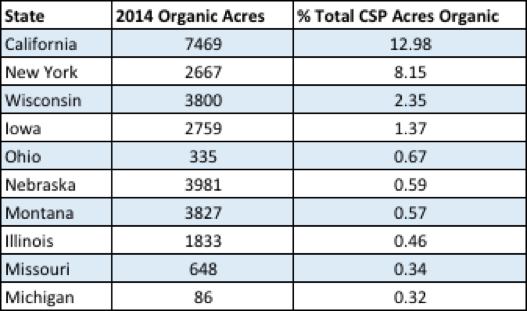
California’s organic CSP acreage is well above the national average, with nearly 13 percent of total CSP acres certified or transitioning to organic. The table below highlights the ten states that enrolled the most organic acres into CSP in 2014.
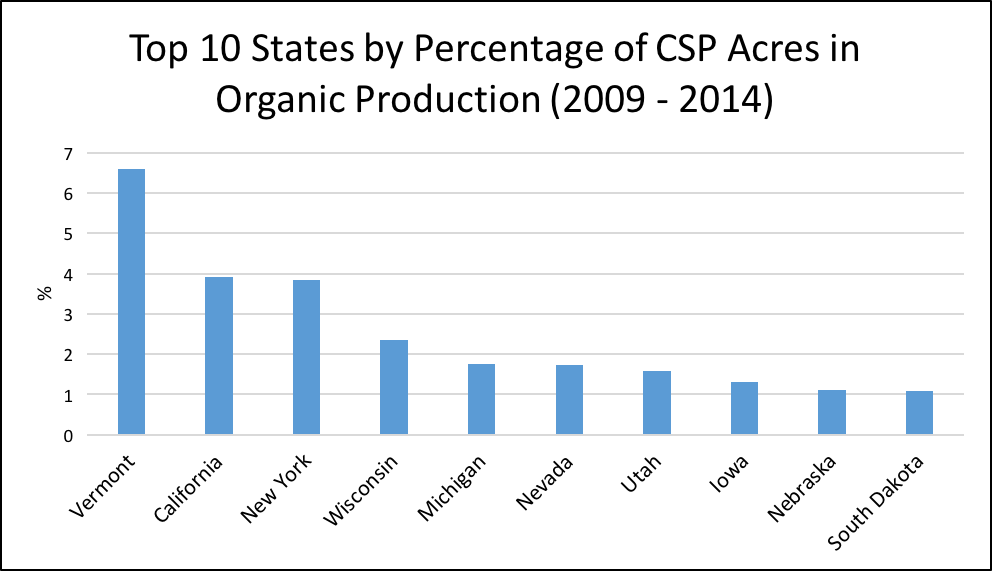
When we look at organic CSP acreage enrolled between 2009 and 2014 as a percentage of total CSP acreage by state, Vermont, California, and New York top the list. In Vermont, more than 6 percent of all CSP acres were organic or transitioning to organic production, which is especially interesting given that Vermont’s ranking by CSP acreage and contracts is otherwise low within the country. The chart below highlights the top 10 states by percentage of organic acres enrolled between 2009 and 2014.
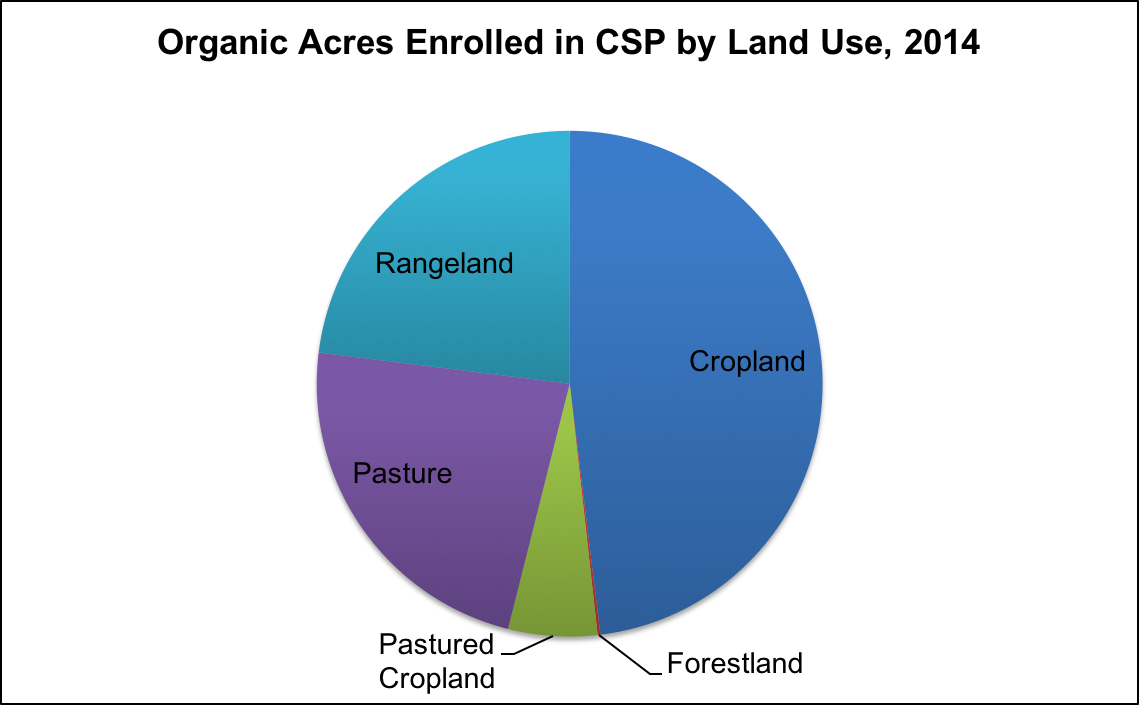
Many different kinds of organic producers utilize CSP, from dairy farmers in the Midwest to specialty crop producers in California. The chart below shows the portion of CSP’s organic acres (certified and transitioning to organic) by different categories of land use. Cropland made up nearly half of the certified organic acres in CSP with 48 percent of total organic acreage, followed by rangeland, pastureland, pastured cropland, and forestland.
Overall, organic CSP numbers illustrate that there is still a clear need to further shape CSP in a way that supports organic producers to the greatest extent possible. NSAC has repeatedly recommended that NRCS establish a transition to organic plan within CSP, as well as the importance of appropriately ranking critical CSP enhancements that can support these groups of farmers and ranchers.
Access to CSP for Smaller Acreage Farms
Access to CSP not only matters for beginning, socially disadvantaged and and organic farmers and ranchers, but CSP must also adequately support smaller acreage farms. Unfortunately smaller farms doing management intensive conservation often lack sufficient acreage for CSP to pay off, because payments are determined by multiplying payment rates by total acres.
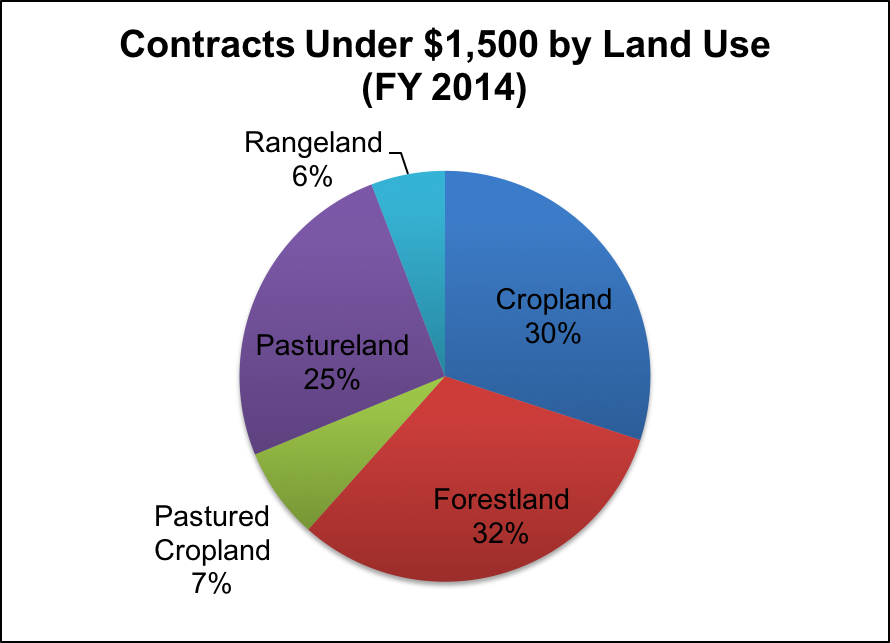
NSAC has advocated to the USDA to make the program easier for smaller-acreage farms to enroll by setting a minimum annual contract payment of $1,500. In 2014, nearly 1,000 contracts were awarded to farmers and ranchers with annual payments under $1,500. The chart below illustrates how these smaller contracts break down by land-use.
At the opposite end of the payment scale spectrum, allowing some farmers to receive two or more times the payment limit drains resources from the program and limits participation in CSP for other good stewards of the land.
NSAC has long advocated that larger farms should be held to the statutory $40,000 annual payment limit by closing the loophole that allows limits to be doubled for joint operations and fails to require active engagement in the farm operation as a condition of eligibility. While tribal land is exempt from the statutory payment limit, 350 non-tribal contract holders received more than this amount in 2014, which we therefore assume can be attributed to the existing payment loophole.
NSAC will continue to stand up for critical changes to ensure access to CSP for a wide range of producers – including beginning, socially disadvantaged, organic, and smaller acreage farmers and ranchers.
An additional aspect of ensuring access to CSP is preventing cuts to mandatory CSP funding through the appropriations process. Part five of this series will build upon the data included in this week’s four posts, and provide an explanation of what’s at stake for CSP funding as the FY 2016 appropriations process continues.